
BTCUSD Coinbase
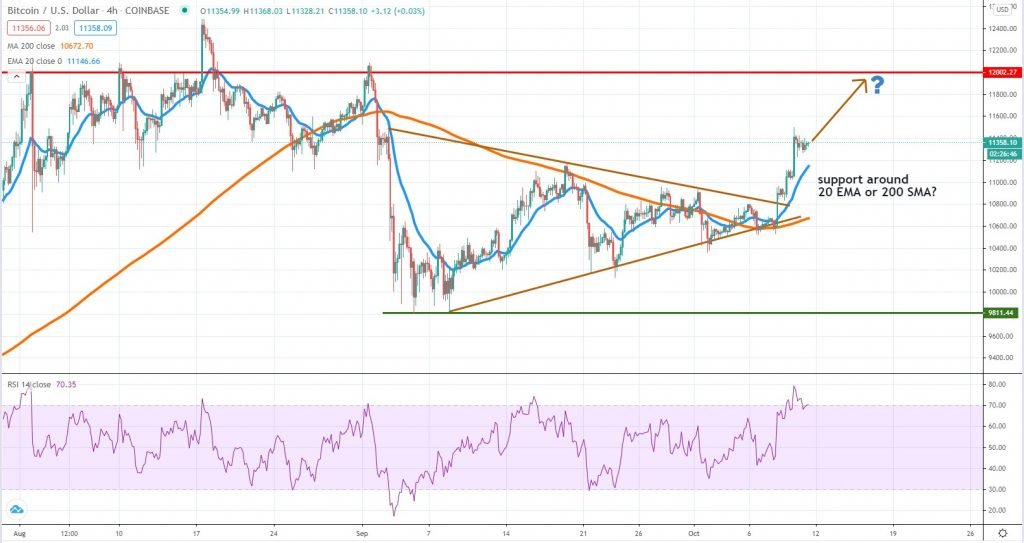
In our last weekly crypto analysis, we’ve highlighted that Bitcoin volatility was dropping as the price was ranging inside a triangle formation. The structure was broken on the upside on October 8th, and since then the buyers had regained control. Some short-term resistance seems to have emerged around $11,500, given the 4h chart RSI had also reached extremely overbought territory.
However, the bias remains to the bulls’ side, even though we could see some minor pullback in the next few days. We suspect support will emerge around the 20 EMA or 200 SMA, and Bitcoin will manage to continue on its way up towards the key $12,000 resistance. That’s where the September selloff started and at least some profit-taking should occur.
Bears are not likely to be the ones in control, since the price should drop below the 200 SMA to suggest that the corrective move lower will continue to extend. Bullish bias looking ahead, but keep in mind the market could take a reversed U-turn at any point, due to increased uncertainty.
ETHUSD Kraken
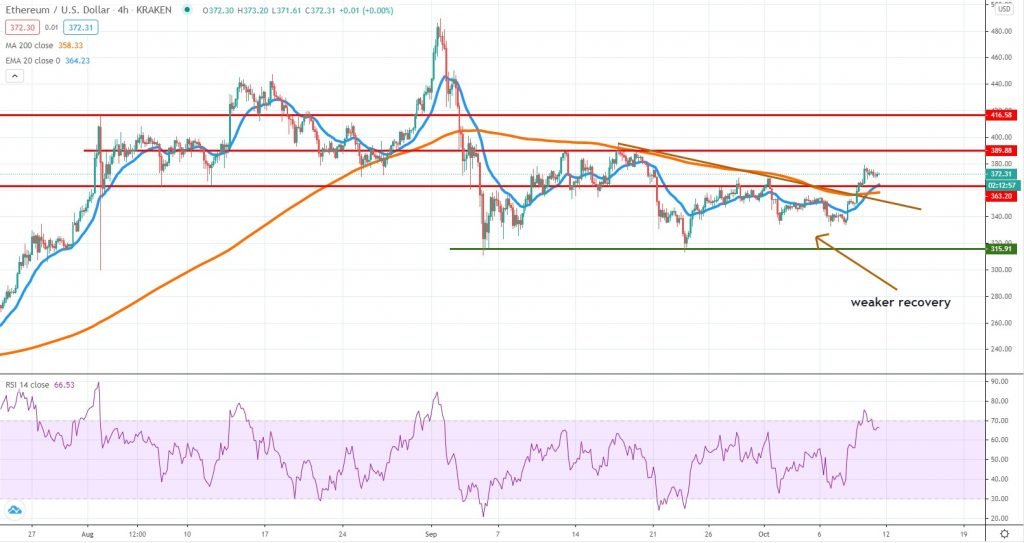
In line with the Bitcoin’s performance, Ether had also managed to recover some lost ground, breaking above a short-term descending trend line we’ve previously mentioned. However, looking at the bigger picture, the token had managed to recover little ground, compared to the September selloff.
This means ETH is an underperformer and that could signal more weakness in case the bearish sentiment will prevail For now, the buyers are in short-term control, which means we could see more gains towards $390, where resistance emerged twice in September. Breaking above it would mean more room will be opened towards $416.
Breaking below the 4h chart 200 SMA and the broken trend line would be a bearish signal and in that case, we expect Ether to drop towards $315 again. Support had emerged twice there and buyers were strong enough, but if a third test will occur, more pain will lie ahead for the second-largest crypto.
LINKUSD Kraken
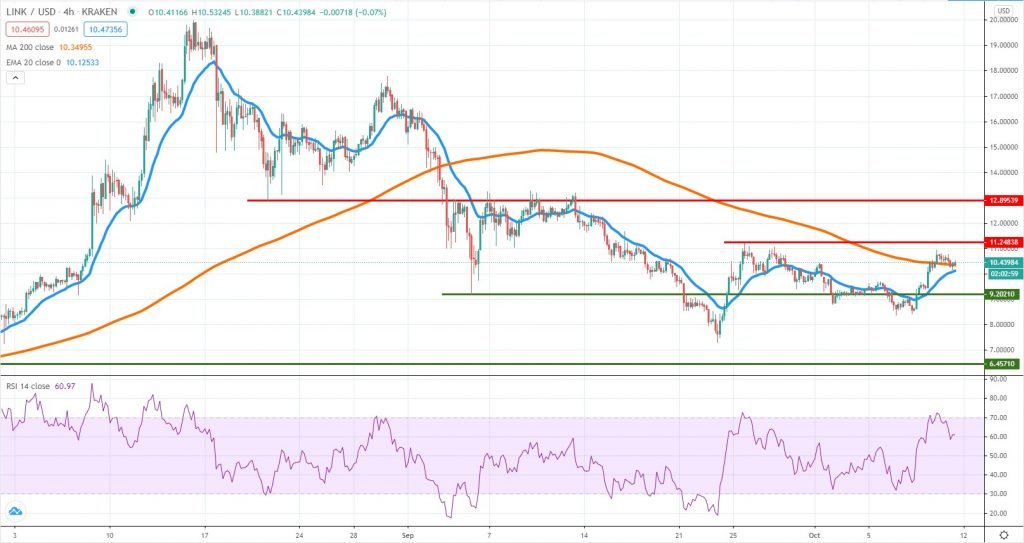
Although one of the best performing DeFi tokens, Chainlink dropped more than 60% since mid-August. However, at the end of September, some support emerged around $7.5 and now the price is struggling to break above the 4h chart 200 MA. If that will be the case, then the next challenge for buyers will be around $11.2 where resistance emerged on September 25th.
The recovery could accelerate further on a break above it, with the next mid-term target located around the $13 area. Despite some short-term optimistic performance, it would be important to consider that following such a massive drop, the bottoming formation could take longer to form.
If the selling pressure resumes, watch for support around $9.2 and in case that zone fails too, then it is very likely that the bear market had not ended yet and more pain will lie ahead for Chainlink. Major support is located around $6.5 but we should wait and see how the market reacts in case the price reaches it.


There are no comments at the moment, do you want to add one?
Write a comment