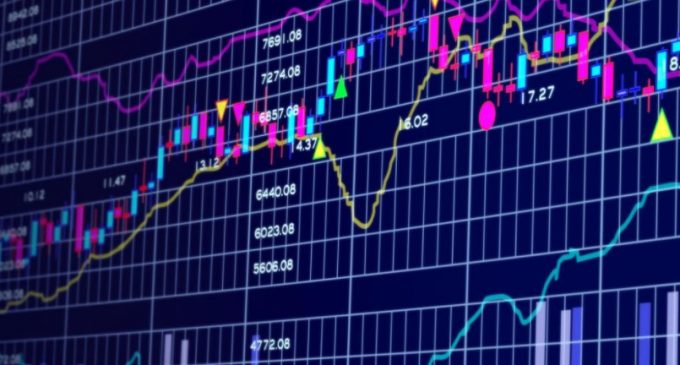
BTCUSD Bitstamp
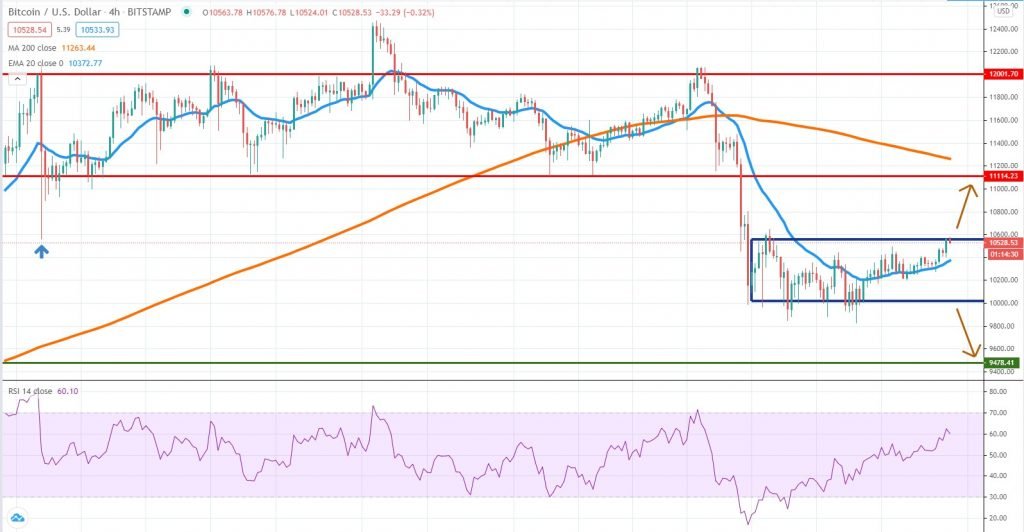
The $10,000 area had been strong-enough support for Bitcoin and the past week, the price formed a short-term bottoming formation around it. However, the upside had been limited and the $10,500 capped further buying. It’s good to see the RSI rising from oversold levels, but compared to the selloff, buyers still have a lot of ground to recover.
A breakout above the range highlighted in our chart will unlock further upside potential, with the $11,100 and the 4h chart 200 MA as the next resistance levels to watch. The price is trading above the 20 EMA and that’s good news for buyers, as long as impulsive selling does not resume.
Strong selling reemerging could push the price back towards $10,000. A breakout below the last week lows won’t be encouraging, considering Bitcoin might slide further, towards $9,500. At this point, some more upside in the next few days seems likely, but keep in mind the market sentiment can shift fast.
ETHUSD Kraken
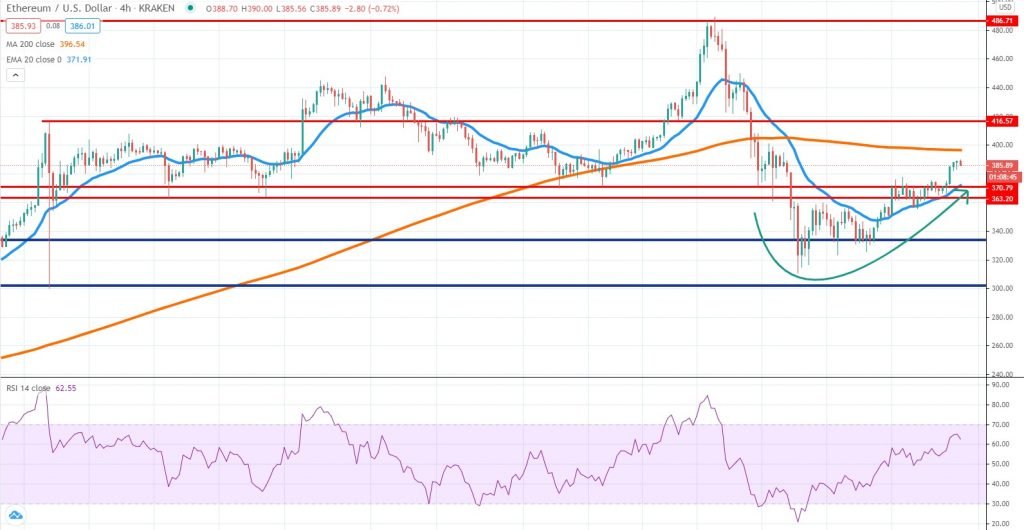
The demand area we’ve highlighted in our last weekly crypto analysis was strong enough to stage a more robust bullish leg. It is true Ether had been more volatile than Bitcoin, a negative factor during the selloff, but one favoring buyers that the recovery is underway.
Buyers can cheer the fact that the price broke above $363-$370, a key area we would have expected to generate more selling pressure. That wasn’t the case, and now ETH is very likely to reach the 4h chart 200 MA. The RSI is not yet in overbought territory on the 4h chart, but it will be a key aspect to monitor, in case the bullishness will continue.
If strong selling emerges again, we should watch how the price reacts around $330-$300. Breaking below that will be a major hit for the overall bullish trend, but we’re far from that happening now. Technicals had worked extremely well in determining the price formation, so keep a close eye on the important areas we’ve highlighted.
XRPUSD Kraken
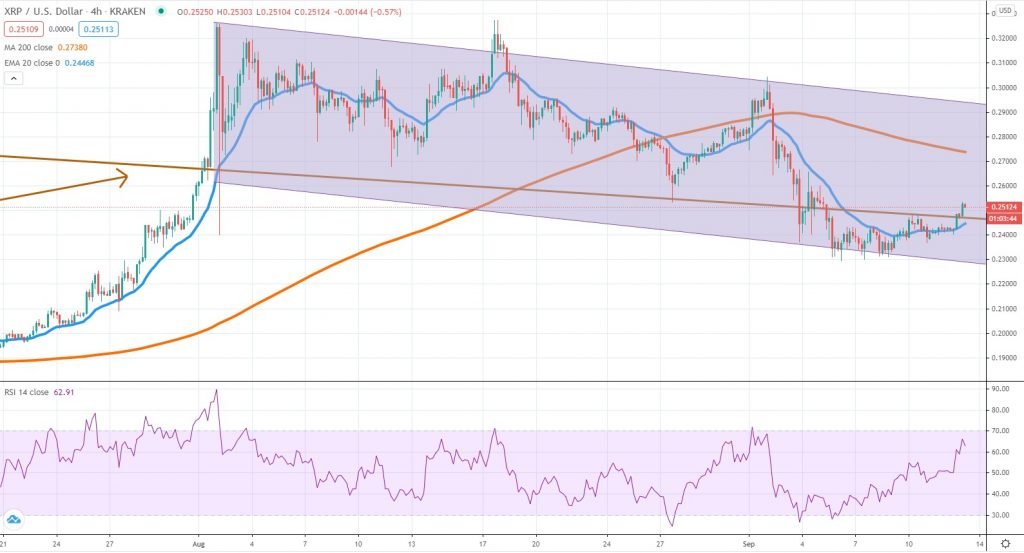
Since the beginning of August, XRP had been in a major corrective structure, after breaking a key bearish trend line. Buyers had been reluctant to keep pushing the price higher, but sellers were neither impulsive. This consolidation had created several trading opportunities, both on the upside and the downside.
The recent selloff drove XRP towards the lower bound of the channel and since buyers had been successful in defending it, we expect the price to edge higher, towards the 4h chart 200 MA the upper line of the channel.
Breaking below the channel will be a bearish sign and could mean XRP will erase more gains. That’s not the most likely scenario, since we expect the price to break above the structure, once the bullish sentiment will resume.
However, we don’t know yet when that’s going to happen, which means a bumpy ride could await in the short-term horizon. It is good to see the market continues to respect the channel, creating many opportunities for traders that want to get involved in stable cryptocurrencies.


There are no comments at the moment, do you want to add one?
Write a comment