BTCUSD (Coinbase)
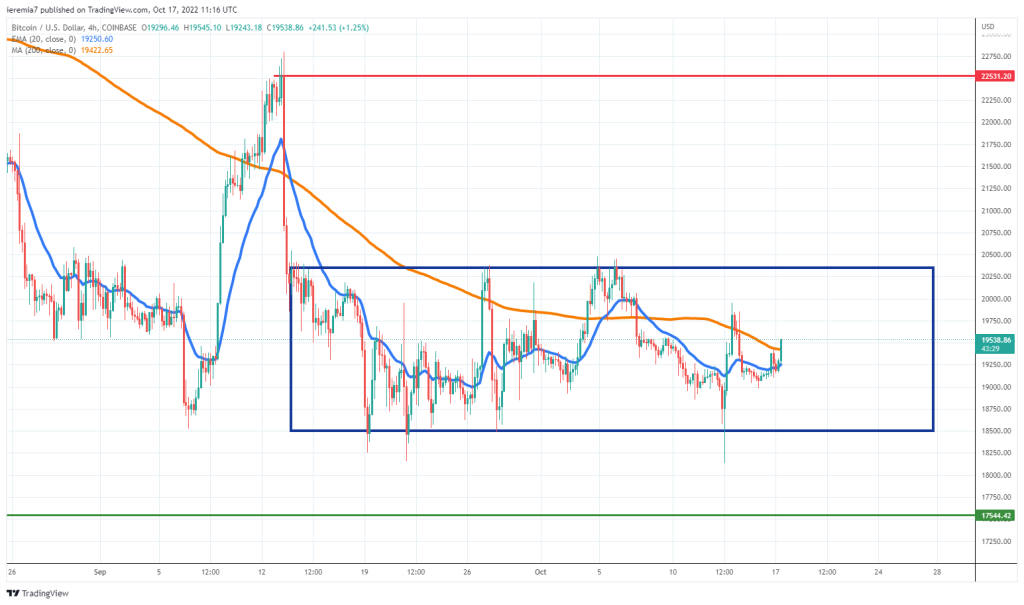
Bitcoin continues with a rather choppy performance, but despite that, the price respects a range formed between $18,500 and $20,350. Even if US inflation came hot, the initial slump was followed by intensive buying and now BTC is trading close to $19,500.
Given the current period generally leads to positive returns in the crypto space, we are favoring the upside slightly, as long as the US Dollar, and interest rates won’t continue to move up impulsively. Bitcoin is closely correlated with the Nasdaq, so if tech stocks show signs of stabilization, that can act as the green light for BTC buyers.
A break and daily close below the lower bound is a negative sign to watch since that will tilt the probabilities in favor of sellers. Conversely, breaking above $20,500 should be regarded as bullish and in that scenario, Bitcoin can edge higher toward $22,500. Traders are still reluctant to take more risk, especially since good news fails to appear.
ETHUSD (Kraken)
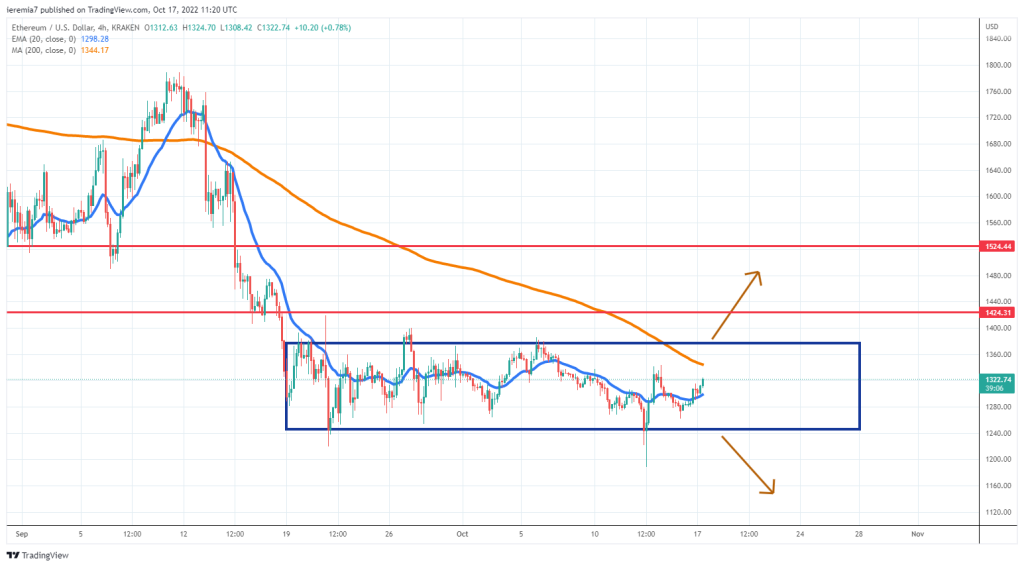
Similar to what’s happening with Bitcoin, Ether is also stuck in a range, a structure we discussed last week as well. The price failed to break and hold below $1,250 and that acted as a short-term buying signal. Bulls took advantage of the dip towards $1,200 which ended up being a smart choice, considering ETH is now trading above $1,300.
Daily ranges are small and although traders are still waiting for the kind of volatility seen last year, that period might not come too soon. Breaking above the 4h chart 200 SMA and then the upper line of the range is needed to confirm the bottoming formation. If this scenario turns out to be true, our first upside target is located at $1,500.
On the other hand, in case of sellers drive the price below the 20 EMA and also break below the bottom of the range, it would mean the past few weeks have been just a consolidation, and trend following to the downside will be next.
QNTUSD (Bittrex)
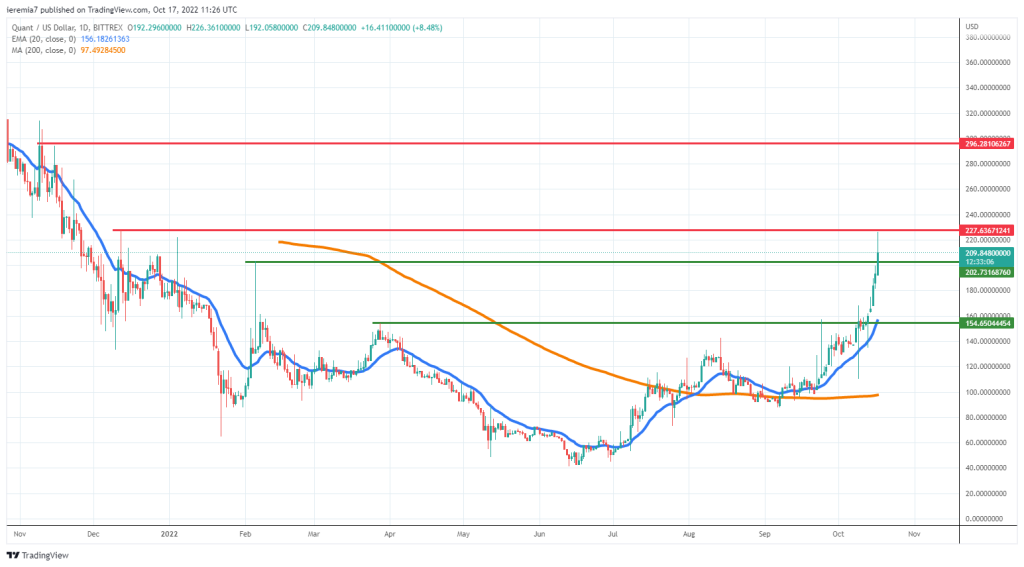
While BTC and ETH remain range-bound, other smaller tokens are posting bigger returns. It is the case with Quant, a token we’ve covered recently that has managed to go on an impressive run higher.
This token is up 400% from the June lows and the pump does not show any signs of weakening. However, traders should watch how the price reacts to the $230 resistance. If the buyers break above, $300 is the next level to monitor. Shorting the market at this point is not appropriate, given there’s no reversal confirmation yet.
But QNT won’t edge higher in a straight line, so buyers who want to gain exposure from now on should wait for pullbacks toward $200 or even $155 if the broad market sentiment starts to deteriorate even further.
Quant has bottomed and is now in an established uptrend. It will take a break below $100 to reverse course and that scenario does not seem likely right now.


There are no comments at the moment, do you want to add one?
Write a comment