
BTCUSD (Coinbase)
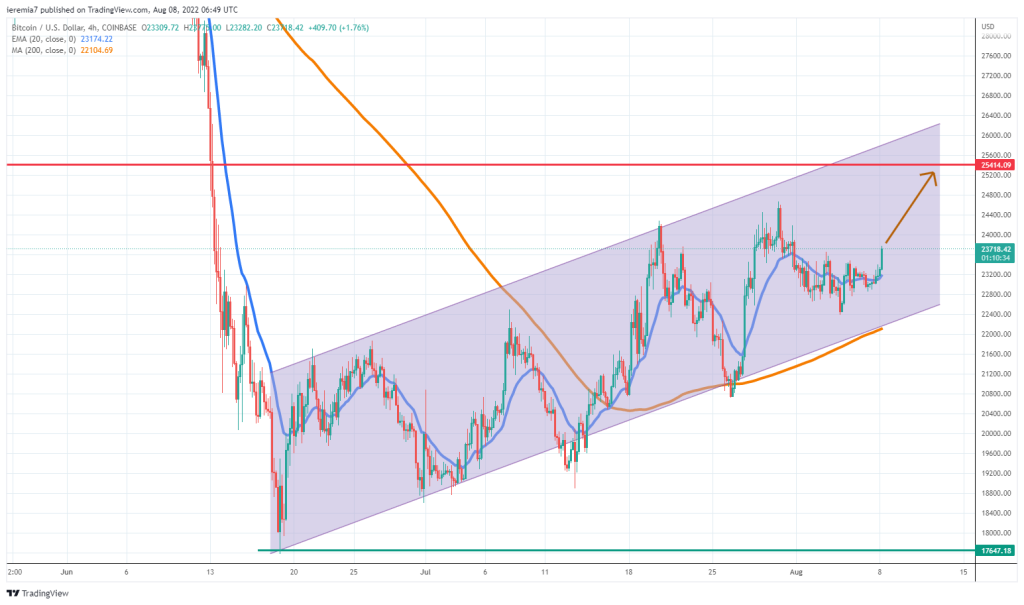
Another week passed and still, Bitcoin continues to post a sluggish performance, suggesting a lack of appetite for riskier assets. The price was mostly on the retreat, even if it did not breach the channel we talked about last week.
Because the ranges are narrow, we’ll focus on the 4h chart this time, where some interesting details can be spotted. First, we see the 20 EMA is now treated as support and the directional bias is pointing up in the short term. As long as we are still inside the channel, it’s possible to see BTC retesting $24.5k and maybe even get to the $25k area for the first time since the beginning of June.
The US job report was published on Friday and that suggested the FED should raise rates higher in order to hold a tighter grip on inflation. If that will be the case, it’s bad news for crypto, but for now, the markets don’t seem to price in that scenario aggressively, given the next FED meeting will take place in September. However, this is a factor to consider if you are looking to gain long-term exposure to Bitcoin.
ETHUSD (Kraken)
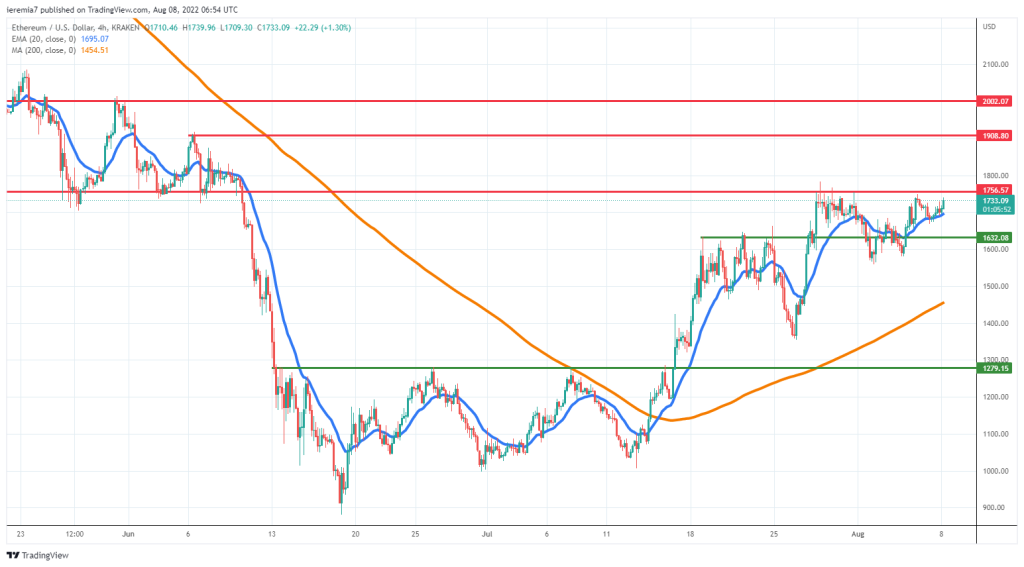
Things look slightly better in the case of Ether, although the price has been sideways over the past week. Looking at the bigger picture, the bullish parabolic structure remains intact, which gives buyers a good advantage.
The only risk is that a double top formation will occur around $1,750. Buyers need to look for signs of impulsive selling around that area and if that will be the case, $1,600 will have to be defended. Lower breaks can drive ETH towards the 200 SMA and then $1,300.
Speaking of the upside scenario, Ether needs to break above the June 28th high. If the break will be sustained, then there’s an increased possibility the leg up can extend towards $1,900 and $2,000. Those are key levels to watch, where selling interest can resume impulsively.
BNBUSD (Binance)
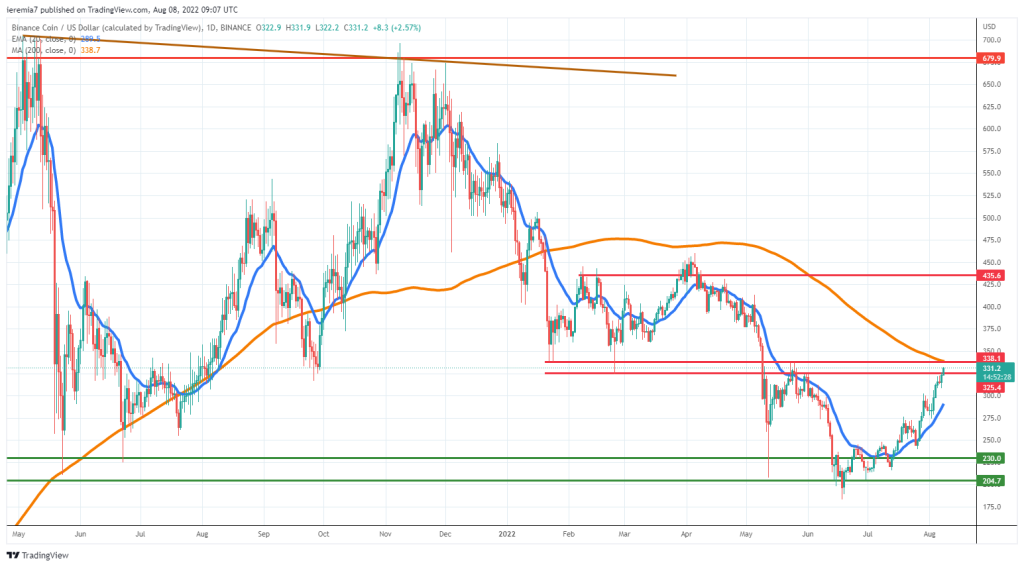
Traders looking for cryptos with more directional bias should consider Binance Coin, which is up over 15% during the past week. Compared to ETH and BTC, we can notice BNB continued to break higher and is now approaching a critical resistance area formed between $340 and the daily 200 SMA.
That could also turn out to be a hurdle for bulls, in case they want to keep pushing the price higher. Compared to the June lows, this token is up almost 100%, a decent performance given how poor the crypto market has been treated.
If the broad market sentiment won’t improve, a break above the resistance mentioned will become less likely. A pullback will be healthy because buyers can enter at more attractive valuations. The daily 20 EMA and $275 are levels to watch. Below the sellers can push the price towards $230.
Breaking above the daily SMA will mean entering bullish territory from a technical perspective, which is why we advise people to consider the broad market performance as well.


There are no comments at the moment, do you want to add one?
Write a comment