
BTCUSD (Coinbase)
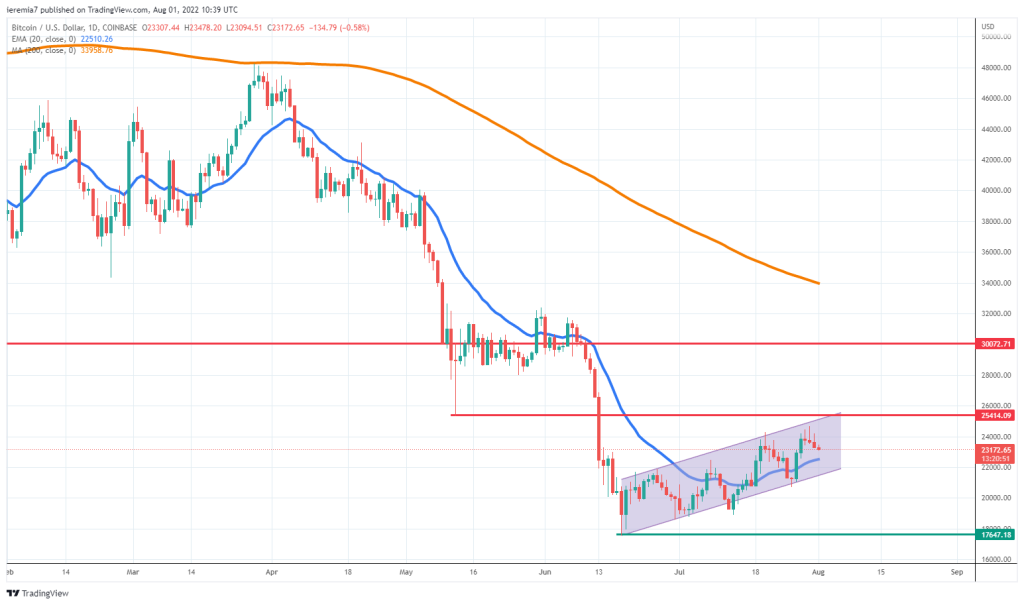
It has been another steady week for Bitcoin and given the price managed to break above the July 20th high, that further reinforces the slight bullish strength. We can easily notice that BTC is moving up in an ascending channel formation, so as long as it remains in play, traders could stick with the upside bias.
There are three consecutive selling days on the chart, but the price is still trading above the daily 20 EMA. We suspect buyers will treat it as support and then the next move up could take the price up towards the $25k area, where sellers might get more active. Above that, Bitcoin has a clear path ahead to $30k, a stronger resistance where profit taking should be expected.
On the downside, we need to see a clear break and follow-through selling below $20k to suggest the sentiment has deteriorated and sellers are back in control. That’s not the case right now, but if a risk-off event starts to weigh on BTC, the June low could be retested again.
ETHUSD (Kraken)
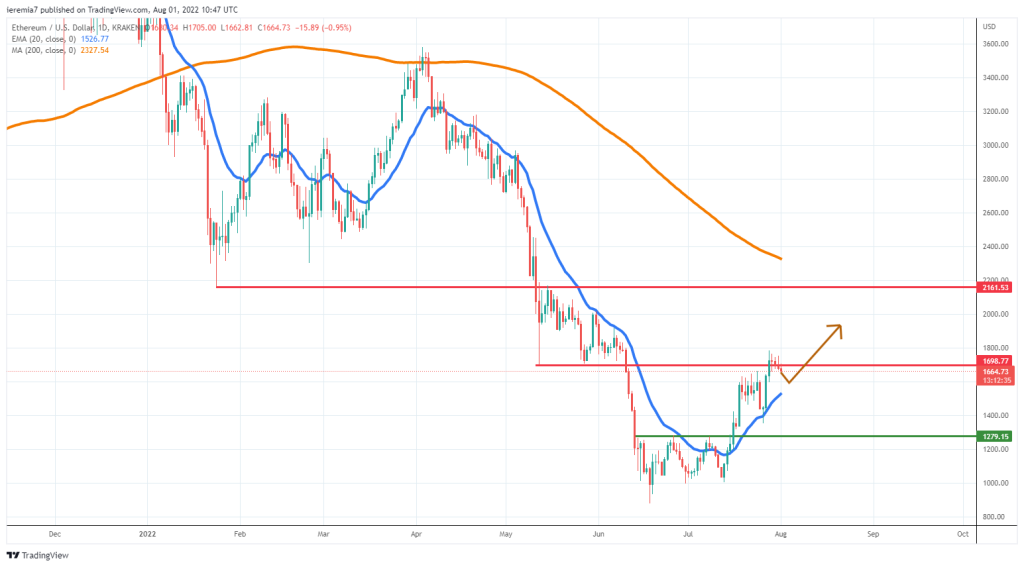
Ether continues to show more bullish strength compared to Bitcoin and right now the price is hovering around $1.7k, a prior swing point going back to May this year. Although the bullish leg up stalled, we see little signs of impulsive selling, so there is still scope for more gains if the optimism persists
The FED meeting turned out to be a major risk driver and now that the biggest central bank plans to move up with rate hikes cautiously, investors and traders treated the decision as a green light to buy risky assets such as crypto.
Technically, the price of ETH bounced strongly off the daily 20 EMA, so as long as the pattern won’t break, we think the coin can move towards $2k. That’s when the price will get near the daily 200 SMA as well and buyers should expect a stronger pullback in case of a retest. Either way, the picture looks good for bulls at the start of August.
DOTUSD (Kraken)
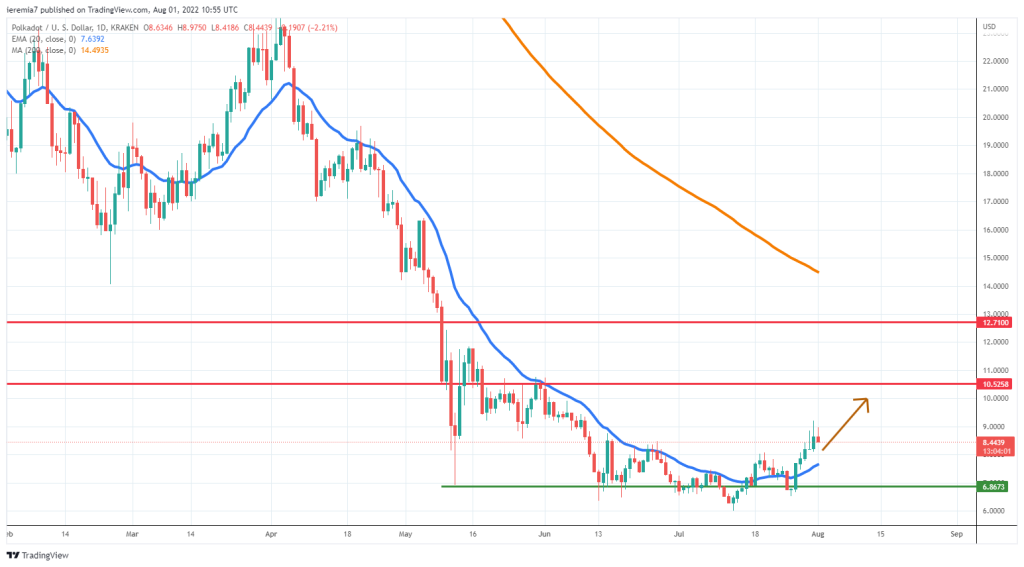
Polkadot was up over 20% during the past week, suggesting buyers have been interested in this heavily-beaten DeFi token. From a technical perspective, the daily 20 EMA is no longer treated as resistance, so that bodes well for sentiment now that a new month has started.
A base seems to have been formed around $6.8 and as long as that continues to be bid up by bulls, we have a bottoming formation in place. In this scenario, DOT can continue to move up and only encounter strong resistance near $10.5 and $12.7. Those are important areas to watch since we can see some major prior lows there.
Only a break below $6 can negative the bullish sentiment, but that looks like the less-likely scenario right now. Buyers are expected to enter the market on dips, taking advantage of lower prices as the structure shifted in their favor after months in a row during which sellers have been dominating the market.


There are no comments at the moment, do you want to add one?
Write a comment