
BTCUSD (Coinbase)
Source: TradingView
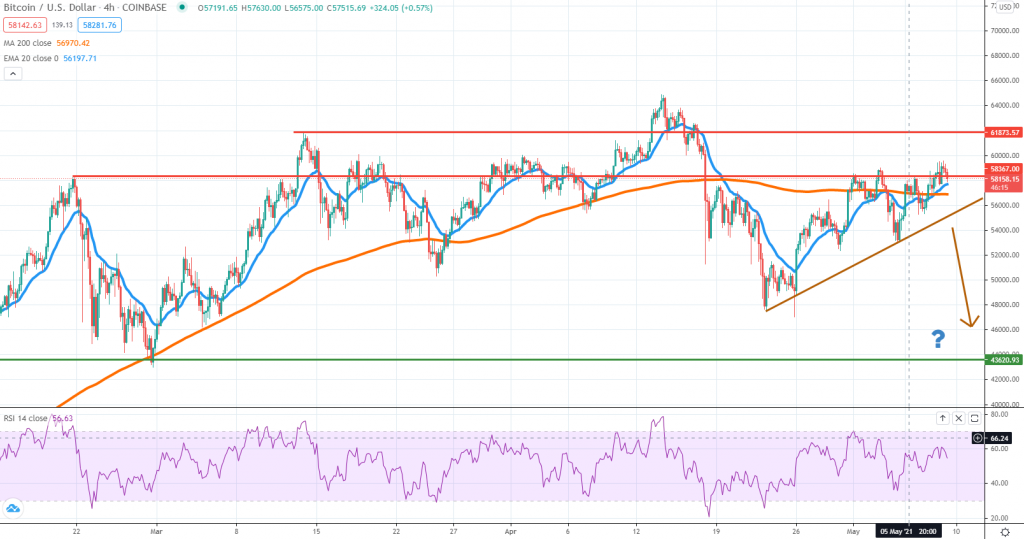
Bitcoin had continued to recover from the April selloff, but still trades below the all-time high and not yet confirming the bias changed towards the bulls. At the time of writing, the price action is struggling to break above $58,300, which is why the prospects for a continuation higher are reduced.
Even if the buyers manage to push the price above over the next several days, we suspect the market might be poised for an A-B-C type corrective move, leaving buyers who are buying at these elevated levels trapped.
The early indication for a bearish shift will be a breakout below the 20 EMA + 200 SMA and the short-term trendline highlighted in our chart. If that will be the case, Bitcoin could weaken towards the $43,000 area before finding strong buyers.
On the upside, the only hope for a continuation higher is if the price breaks above the all-time high, treats it as support, and then continues higher impulsively. As the seasonality continues to get poorer during the summertime, that’s the least likely scenario.
ETHUSD (Kraken)
Source: TradingView
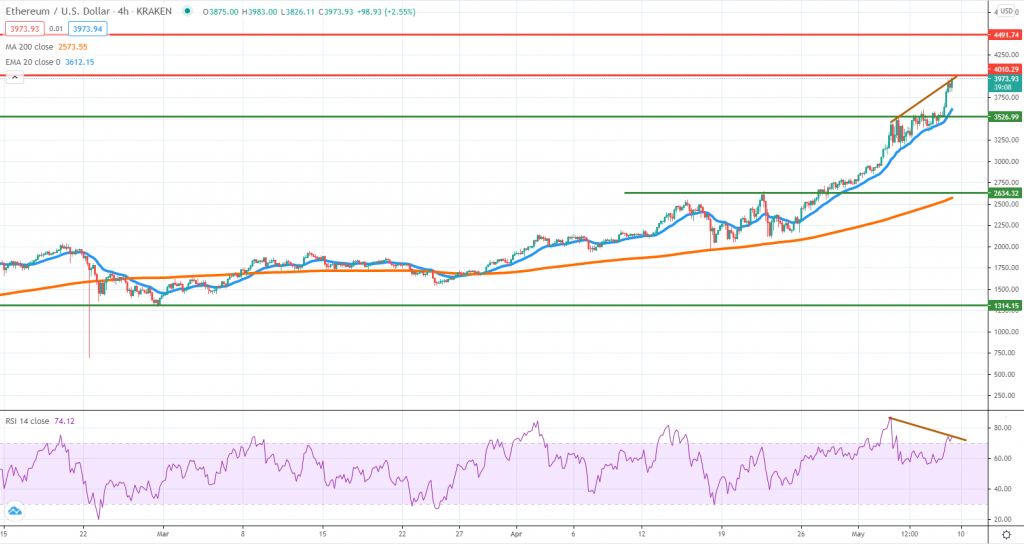
Nothing seems to be stopping the ETH rally as the price is closely trading near the $4,000 mark. It is the first time in history this is happening, and it should act as a self-reinforcing pattern for more buying in the near term.
Finding critical resistance areas in an uncharted terrain is extremely difficult, which is why traders should first look at key psychological areas such as $4,000 or $4,500. Also, the exhausted-type price action or reversal candles can signal a pause in the rally and the start of a corrective move.
Since April 25th, the Ether price had been trailing above the 4h chart 20 EMA and a break below that average will be a sign of weakness. Traders should be looking at $3,500 as the first major support area. Another important factor to consider is a potential RSI divergence now forming on the chart, which is generally a bearish signal.
ADAUSD (Binance)
Source: TradingView
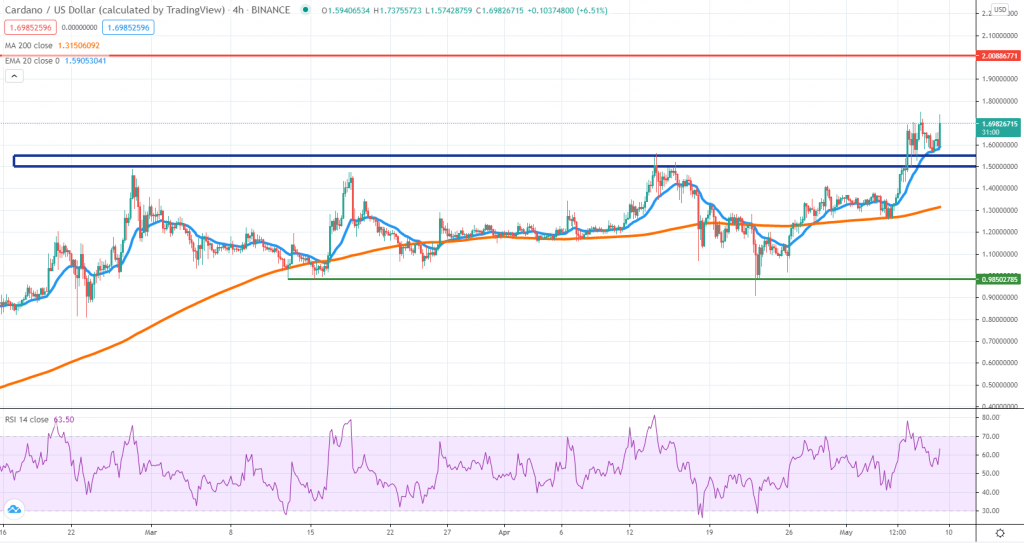
Cardano made an important leap forward during the past few days, after managing to break above the prior all-time high. The price action shows that market participants had treated the broken area as support and now there is potential for more gains on the upside.
Traders should be looking at $2 as the next key resistance area and if the trend extends above it, an overshoot should not be excluded. All the technical conditions are favorable for the bulls and only an impulsive break back below $1.5 could negate the sentiment.
The price should start trading below the 4h chart 20 EMA and treat it as resistance, same as it happened during the second half of April. Next in line would be the 200 SMA, which had been treated as support on May 5th. For now, the sentiment remains tilted to the upside, even though Bitcoin is underperforming many of the large altcoins.


There are no comments at the moment, do you want to add one?
Write a comment