BTCUSD (Coinbase)
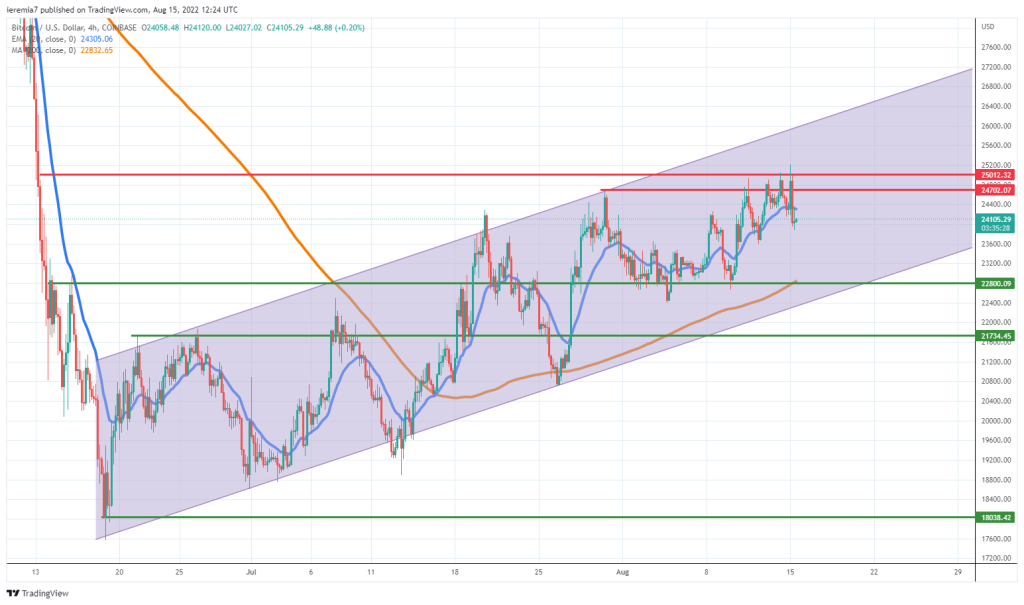
Summer trading time is now the norm and we continue to see subdued ranges in the price of Bitcoin. Even though it reached $25k, buyers were unable to sustain the gains, something that usually happens in a market where liquidity is thin and false breakouts occur often.
The price action is showing the $25k acted as a supply zone and market participants used it as an opportunity to either trim long positions or initiate some selling orders. Starting the new week, the sentiment is sluggish, in part due to poor economic data out of China.
Keep in mind that crypto is the most volatile asset class and when there is little appetite for risk, Bitcoin should underperform. We continue to see BTC fluctuating inside the ascending channel, which is why there is no reason to panic right now.
Even if the price drops to as low as the 4h chart 200 SMA, failure from sellers to drive it below will mean buying interest has not vanished. On the upside, a break above $25k will act as a green light for continuation towards the upper line of the channel.
ETHUSD (Kraken)
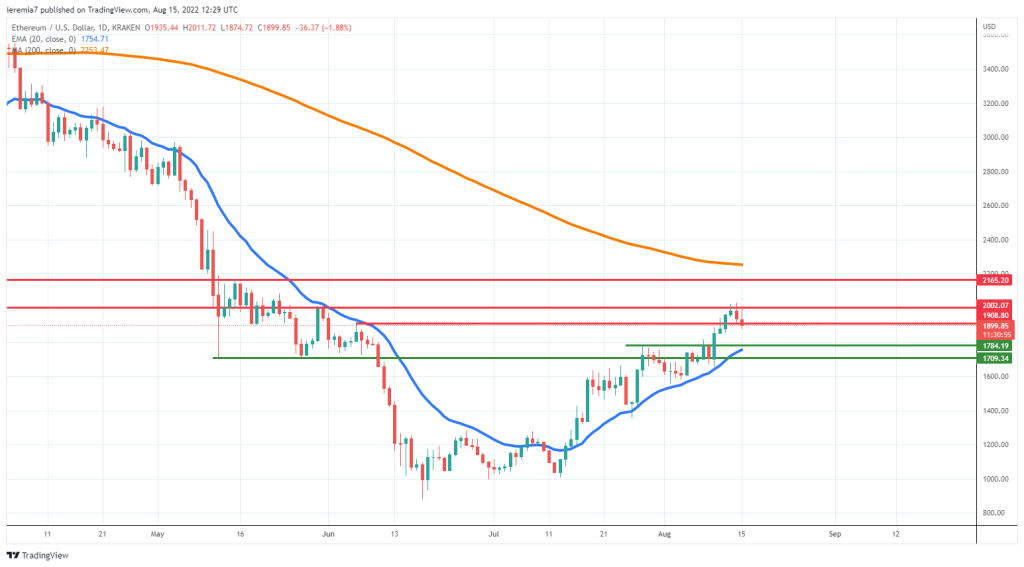
Looking at the daily chart, Ether continues to have a more directional bias as compared to BTC. The transition towards PoS has been the main headline and market participants have been eager to buy the token, anticipating these new blockchain improvements will favor the second largest crypto project.
As we’ve anticipated in our last week’s analysis, Ether found decent recent around $2k and we are now seeing the second daily red candle. Still, no change to the overall picture, which means buyers should resume stronger around $1.8k, where the daily 20 EMA overlaps.
A break and hold below $1.7k will be a stronger sign of weakness and in that case, buyers should change their plans. If that scenario will not materialize, we think the price can go above $2k and retest the daily 200 SMA now located a little above $2.2k.
SHIBUSD (FTX)
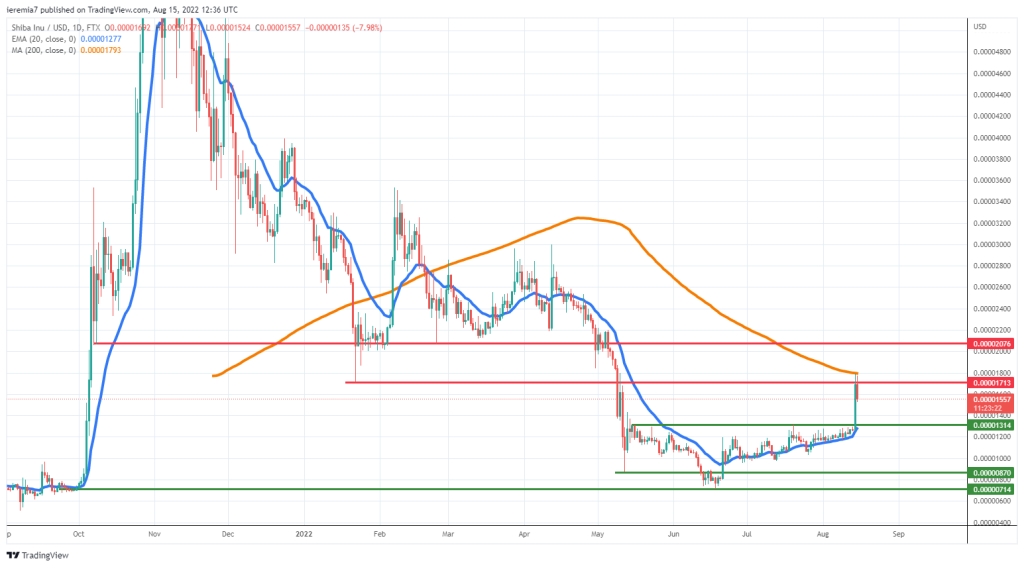
The greater appetite for risk can be seen in dog coins as well and Shiba Inu has risen over 20% during the past week. However, technicals continue to matter, given that Shib started to weaken near the daily 20 EMA. 1713 satoshis seems to be a strong level of resistance and only if the price manages to break above, we could see more upside towards 2000.
Based on current conditions, the price could weaken towards 1314 before finding strong bids. Things can get even worse for bulls in case the overall risk sentiment deteriorates. This could turn out to be a mini pump and dump scheme, driving SHIB towards the lows seen in mid-June.
Keep in mind that this is just a technical bounce for now and not the start of a new major bull run. Excessive risk-taking should not be embraced. Instead, overshooting in one direction would be speculative events, after which the price can go the other way, trapping those who were late.


There are no comments at the moment, do you want to add one?
Write a comment