BTCUSD (Coinbase)
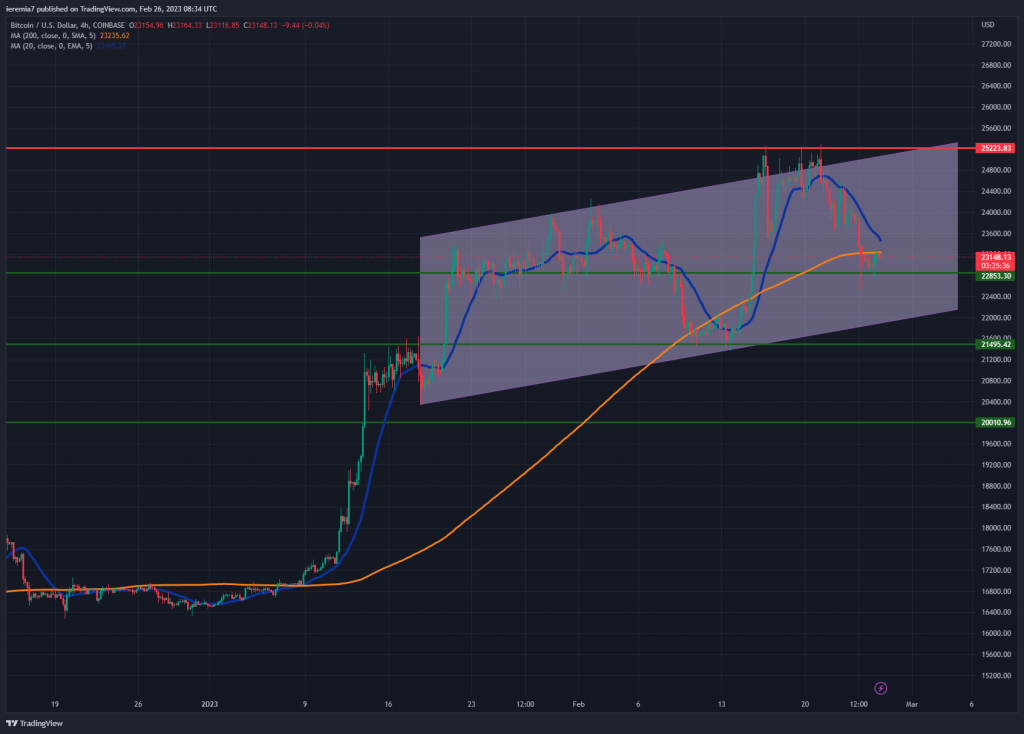
The $25k area ended up as a strong resistance zone since strong selling emerged there. The price broke below the 20 EMA on the 4h chart and is now attempting a bottom little below the 200 SMA. On top of that, we can see BTC is fluctuating inside an ascending channel, meaning as long as the structure holds, the bias remains bullish.
However, the fact that the impulsive buying seen especially in January has weakened is a sign of worry for bulls. The US Dollar and interest rates are rising again, combined with renewed pressure on major stock markets. That’s not a proper environment for crypto to thrive, which is why we want to caution traders.
More selling could follow next week and the lower bound of the channel is the first area to watch for buying interest. $21.5k and then the psychological $20k should cap the downside if the channel doesn’t manage to hold. The upside is capped by $25k until we see a clear breakout and a daily close above that zone. This scenario doesn’t fit in for next week, based on the current price action structure.
ETHUSD (Kraken)
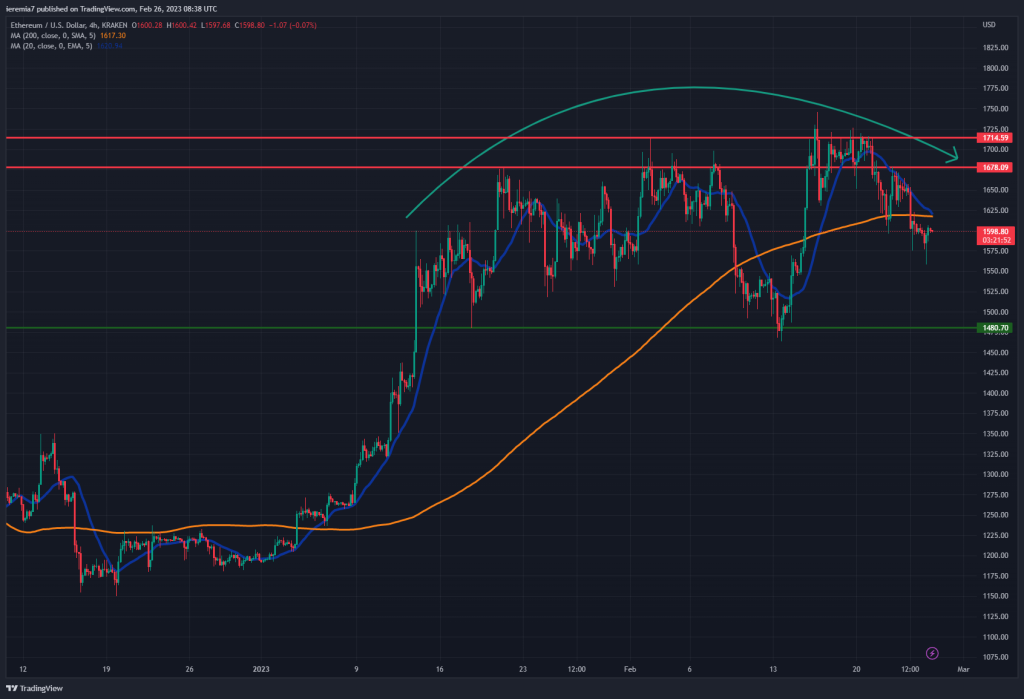
BTC is not the only token that has been weakening in the past week. Ether is also showing signs of topping, at least in the short term. As we’ve mentioned in our last analysis, the $1,700 key area is hard to break and we can now see sellers in control of the order flow.
That happens because the market is treating the 20 EMA on the 4h chart as resistance instead of support. Moreover, the pullback off the 200 SMA failed to generate a larger impulsive move and now sellers are pressuring the price toward the weekly lows.
It’s not the setup you would like to see when looking after buying opportunities. With that being the case, we suspect there’s scope for further selling and $1,500 is the key support to watch. A strong break below it could push ETH toward $1,300.
ADAUSD (Binance)
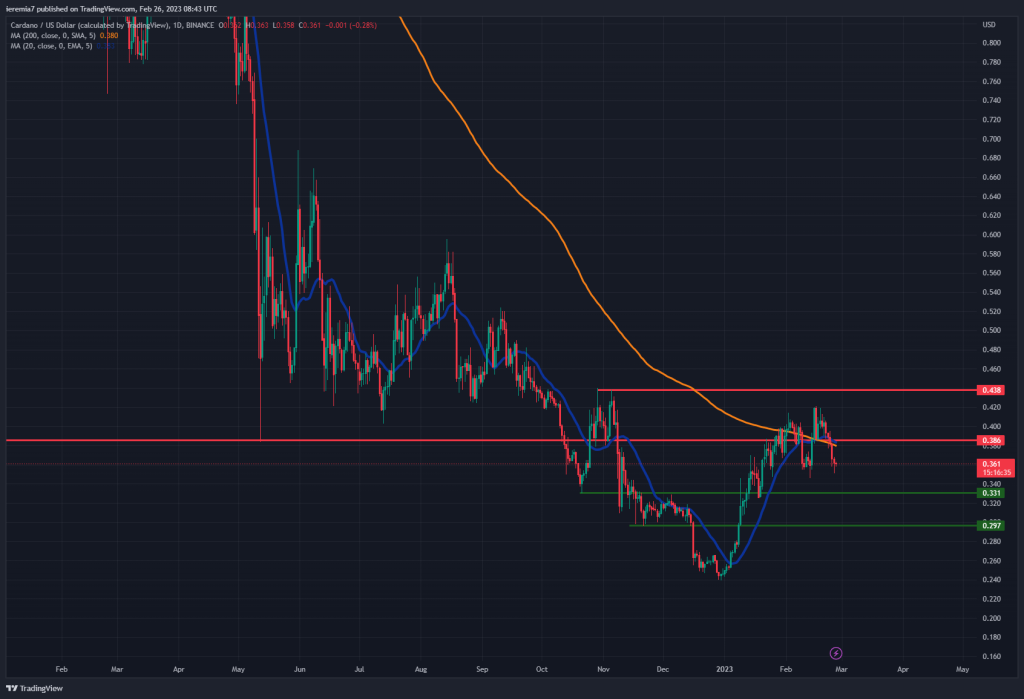
Cardano sold off 10% during last week and when looking at the daily chart, the picture is not encouraging for bulls. Even if there was an initial break above the 200 SMA, sellers managed to drive the price back below the orange line.
We could be during the early stages of a longer bottoming formation and that leaves ADA vulnerable to selling on rips. If selling continues, the 33 cents and 30 cents areas are the levels of support to watch in the short term. Failure to cap the downside around them could result in a retest of the December 2022 lows.
On the upside, 38 cents and 44 cents are areas of resistance. If buyers manage to drive the price above the 200 SMA that will be a sign of optimism, since they will be squeezing ADA at higher levels, attempting a breakout above a key resistance zone. This token is vulnerable if the broad crypto market sells off, so we don’t advise buying at this point in time.


There are no comments at the moment, do you want to add one?
Write a comment