
BTCUSD (Coinbase)
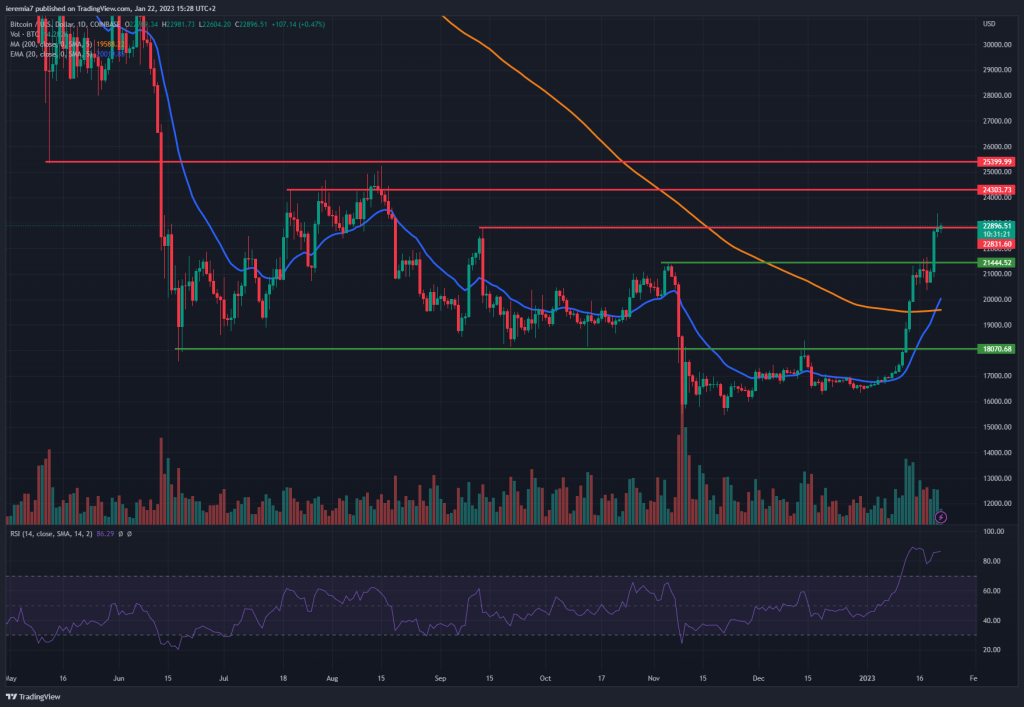
Bitcoin looks poised to end another week with gains, although some details must be considered. First, the price is rising on lower volumes, which might be regarded as an early sign of weakness. Also, right now BTC struggles to break above the $23k area, an important inflection point from September last year.
In case the bull move extends higher, buyers should be paying close attention to how the price develops around $24.3k and then $25.4k. Those are other important areas of resistance, where stronger selling can emerge. Since 2023 kicked in, the price is already up almost 40%, meaning this market might be overdue for a corrective move lower.
If that happens next week, the first major support to hold is $21.5k. As we’ve mentioned last week that’s a key area from November and breaking above it was a good sign for bulls. Now they have to keep BTC above it to further build up a larger move. Failure to sustain that support will move the attention toward the daily 20 EMA and, more importantly, 200 SMA.
ETHUSD (Kraken)
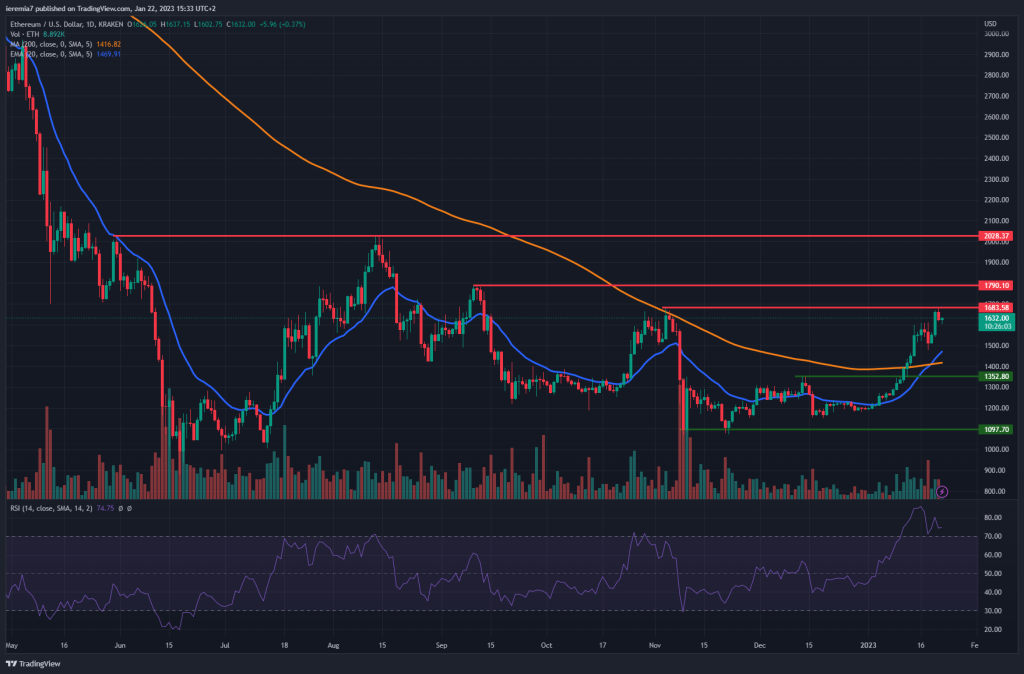
Despite managing to make a new weekly high, Ether has not yet breached the November highs. That’s a sign of underperformance when compared to Bitcoin and might suggest that in the event of a pullback, the selloff could be stronger in this case.
Buyers need to break above $1,700 and once above that level, attention shifts to $1,790 and then the $2,000 psychological area. The broader picture suggests a potential bottoming formation, but confirmation will only come after an impulsive break above $2k.
Until then, we assume Ether is ranging between $1,100 and $2,000. Even breaks on top of the range should be regarded with caution since the fundamental picture has not changed yet. Risk appetite across financial markets remains subdued, suggesting a broader move up in crypto might take a while.
APTUSD (Coinbase)
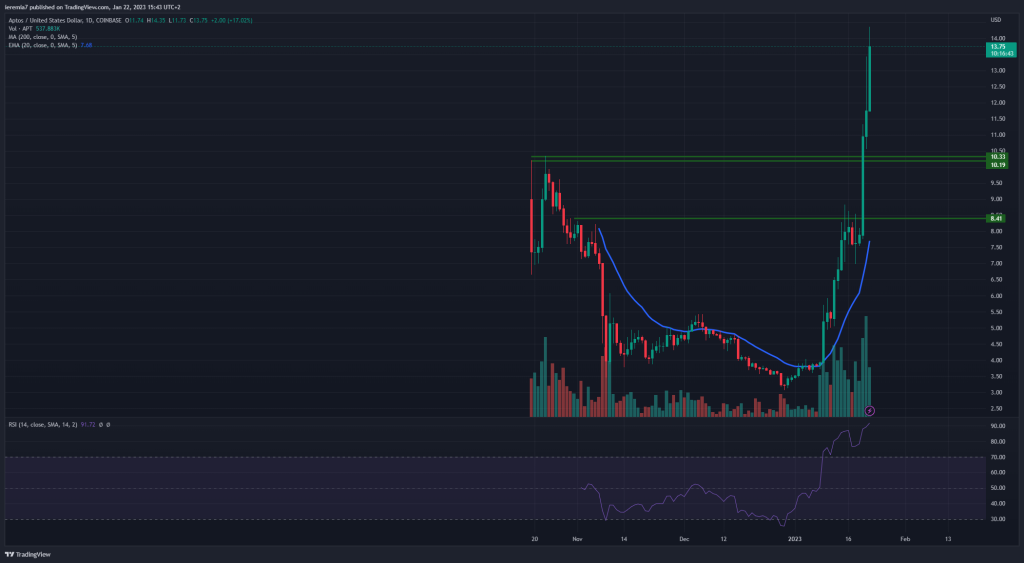
A coin that started to trade on Coinbase last October and is up over 50% last week is Aptos. The move was associated with news published by Binance, but since we’re now focused on technical analysis, some important developments need to be highlighted.
First, APT broke impulsively above $10, which was a high established in October. That’s now turned into a major support, in case the price moves lower sharply. Short-term resistance emerged around $14 and as we move forward, only psychological areas can be considered ($15, $16, $17, etc.) since this is unchartered terrain. Also, traders need to watch for exhaustion formations to get out before a correction unfolds.
At this point, the RSI on the daily chart trades above 90, and despite high volumes behind the rally, it’s not the best technical position to initiate long positions. Buyers should wait for a temporary pullback towards the 20 EMA because that will mean entering at a more attractive price. APT tripled in value since the beginning of the year, drawing attention from many traders.


There are no comments at the moment, do you want to add one?
Write a comment