
BTCUSD (Coinbase)
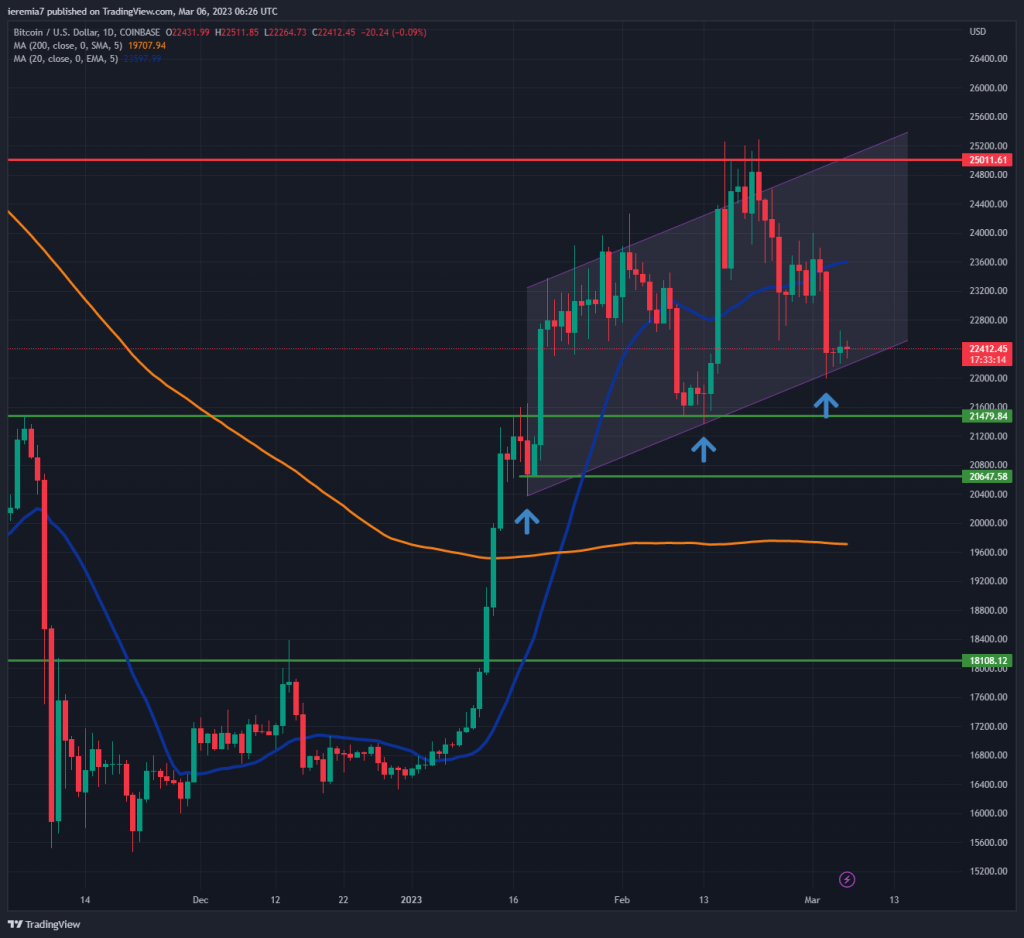
Bitcoin continued to fall last week, but as you can see from our chart, the selloff paused once the lower bound of an ascending channel has been reached. That communicates there is still bullish interest in the market and we might see a rebound this week.
However, thus far the bulls’ reaction looks rather muted, so the bearish scenario should not be excluded. If the channel breaks, buyers can look for opportunities around $21,500 and then $20,600. We are still trading above the 200 SMA, so that’s good for the long haul. Still, the 20 EMA is now overhead resistance on the daily chart, which raises a few questions on whether the bullish move has more legs to go.
As long as the price trades inside the channel, we favor a move toward the upside. The 20 EMA and then the $24,500 – $25,000 resistance area are major upside targets. Breaking the channel on the upside is the least-likely scenario right now, considering the price action has become unstable since the end of January.
ETHUSD (Kraken)
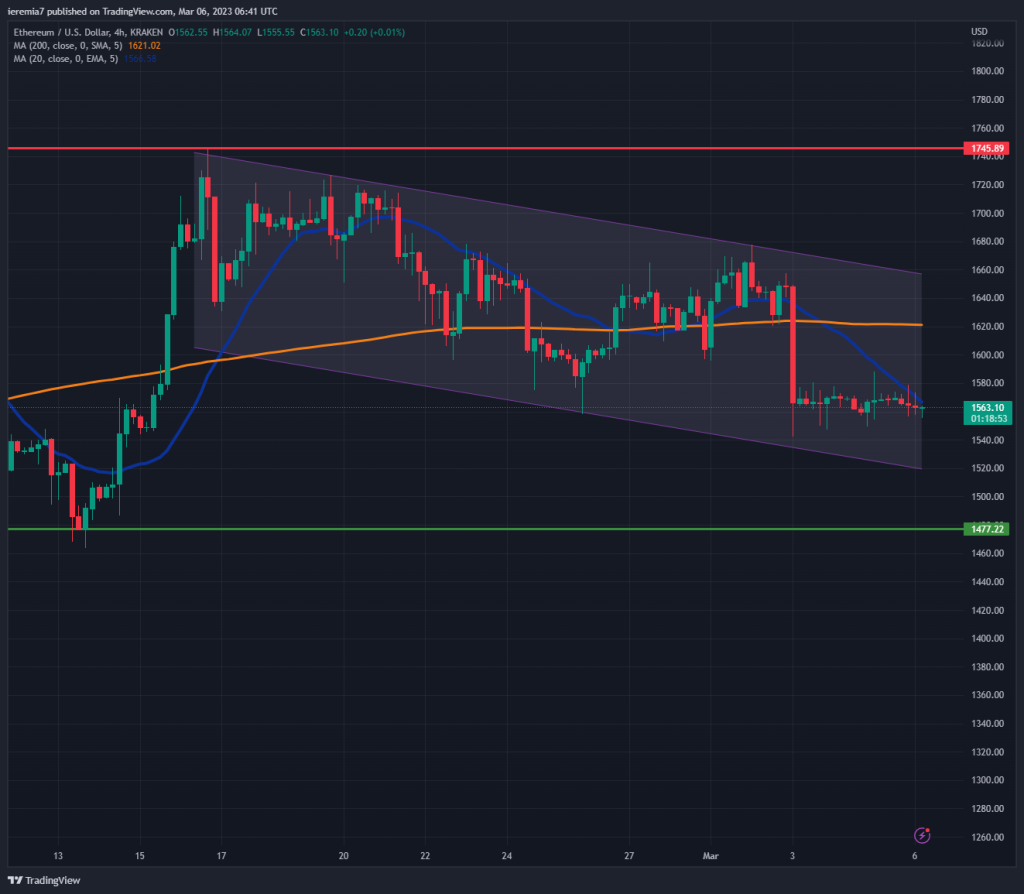
Ether is slowly grinding lower, respecting a bearish channel to the tea. Moreover, the price has breached the 200 SMA on the 4h chart, suggesting a weakening of the bullish trend. Same as with Bitcoin we see a sharp selloff followed by consolidation in a narrow range.
We believe support could emerge near $1,500 because that’s a psychological area and the lower line of the channel is located there. Below $1.5k – $1.45k, we give an edge to sellers, given they can push the price towards $1,300 from that point forward.
If the bullish scenario ends up the winning one, ETH could rebound toward $1,600. A break above the 200 SMA is needed to confirm there might be scope for further gains. For the time being, we believe the upside is capped by $1,750. Only a break above it could unlock $2,000.
DOTUSD (Binance)
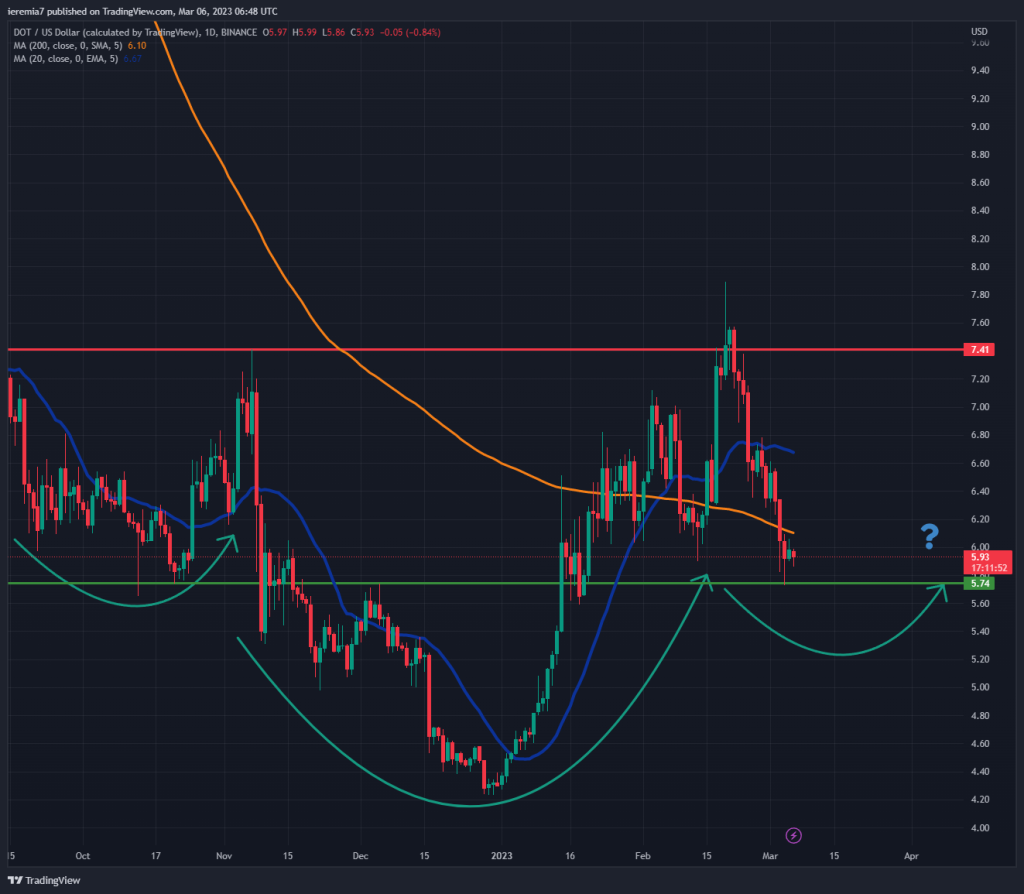
Down 10% over the last 7 days, Polkadot is one of the worst-performing large-cap coins. However, the impulsive selloff does not yet suggest a resumption of the bearish trend. In fact, there could be an inverted head and shoulders pattern currently forming on the chart.
The $5.5 area is the tip of the left shoulder, so there could be a reason why bulls resume in force. This isn’t a done-deal setup and price action confirmation is needed during the next few days. In case bullish sentiment improves and DOT moves higher, $7.5 (the neckline) and then $10 will be upside targets to be aware of.
Even if we suspect the price could rebound higher, it’s important to talk about the bearish scenario as well. For that to happen, we need persistent selling below $5.5. If that will be the case, DOT could continue to weaken towards $4, where it started to rise at the beginning of 2023. Last week was not good for the whole market, so for now, the sentiment is not in favor of a major push higher.


There are no comments at the moment, do you want to add one?
Write a comment