
BTCUSD (Coinbase)
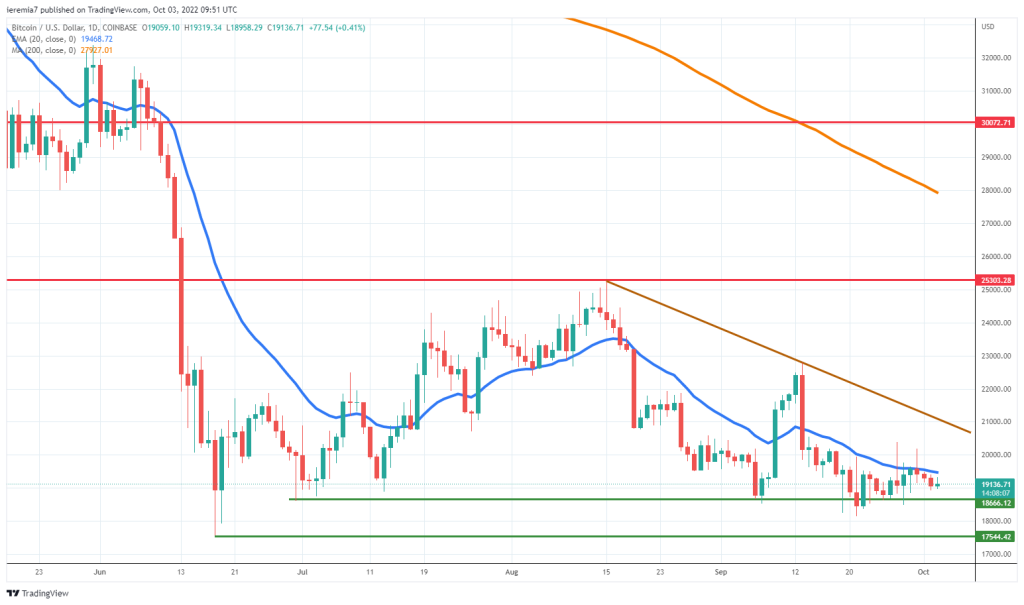
Bitcoin’s volatility has been compressing over the last week and now we see the price locked between the daily 20 EMA and $18,600. There is a lack of momentum in the market right now, suggesting participants are waiting on the sidelines for the next impulsive move to start.
Even if the US Dollar did not make new highs against major peers, demand for riskier assets like crypto remains modest. October is seasonally a better month for BTC, but that does not guarantee gains are about to unfold.
We need to see confirmation from the price action that’s happening and thus far, the performance looks disappointing. Should selling pressure continue, we believe the next line in the sand stands around $17,500, where the current 2022 low is located. Failure to keep above it can open more room towards $15,000.
On the flip side, if Bitcoin breaks above $20,000 and manages to stay above the daily 20 EMA, we might see a new retest of a short-term descending trend line plotted on our chart. Breaking above that would raise the probability for a rebound towards $25,000.
ETHUSD (Kraken)
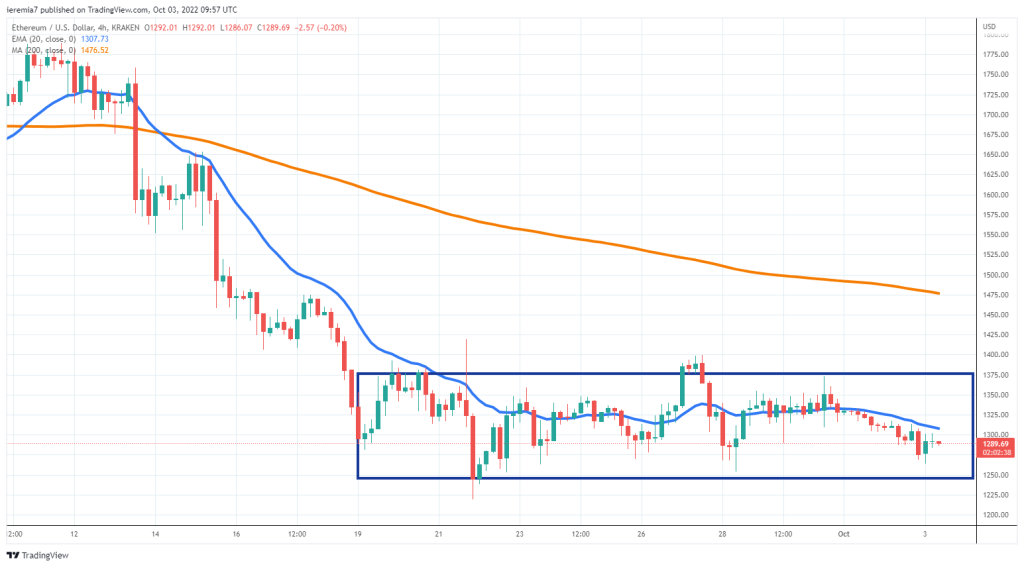
We find Ether is in a similar technical position, showing a sense of balance given the price trades inside a narrow range. Since mid-September, ETH traded between $1,400 and $1,250, as even the merge failed to spur impulsive buying.
Periods when crypto volatility is compressing are precursors to new impulsive legs, so until the break outside the range occurs, traders should remain defensive. Right now, $1,250 is a good place for longs, if we don’t get a strong crack below the structure. Conversely, traders could sell until decent bounces towards $1,400.
Fundamentally, this is still the second-largest crypto project in the world and if flows start to get back into the market, it can benefit. That does not mean it can’t sell off more from here, so if that happens, pay close attention to the key $1,000 support area.
QNTUSD (Binance)
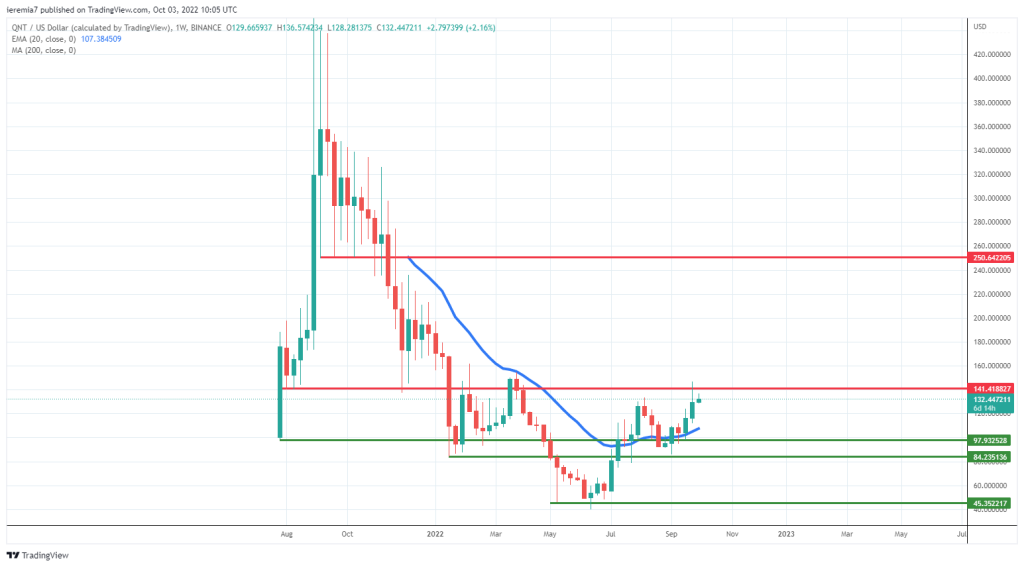
Even in a market dominated by sellers, some tokens manage to stand out. Over the past week, it was Quant that managed to post positive price developments, up 11% at the time of writing. However, keep in mind that this is a relatively-new crypto, launched in 2018, so there is less price action data available to conduct extended technical analysis.
At a closer look, some levels stand out though, like the $141 resistance. The price failed to break and hold above it in January and March this year, some as it’s struggling right now. On the weekly chart, QNT has managed to rebound almost 300% from the June lows, making it one of the major outperformers.
Despite the encouraging move up, corrective moves towards $100 are possible. We believe $100-$85 is key support and only if the market breaks below it, should we revisit the yearly lows. Else, this crypto has room for growth, especially if the broad market sentiment will start to improve in the near term.


There are no comments at the moment, do you want to add one?
Write a comment