
BTCUSD (Coinbase)
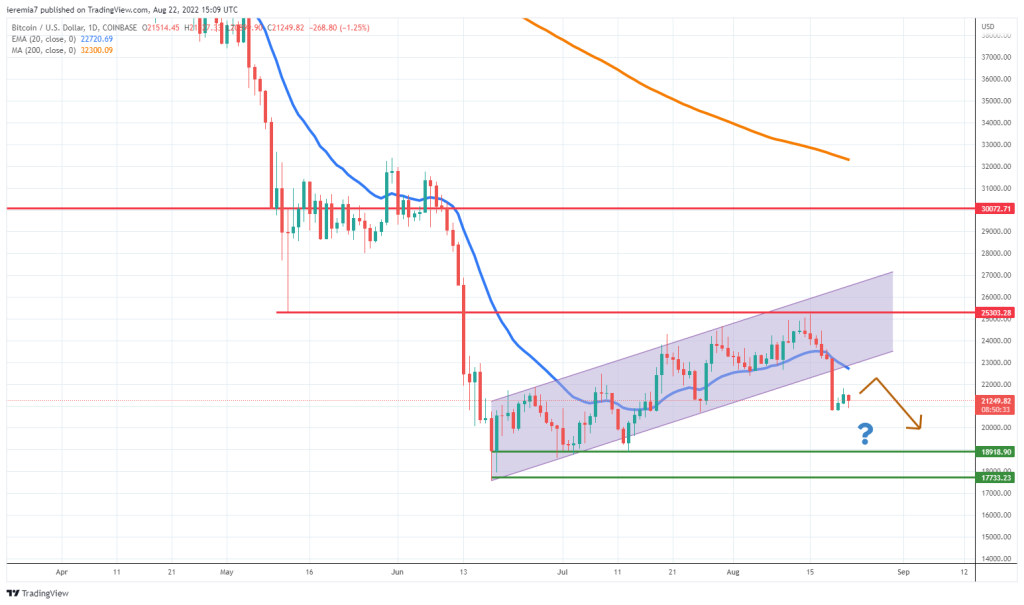
The pain seems to have not ended for Bitcoin, considering last week was a bearish one. The price broke below our channel impulsively and now our view shifted in favor of sellers for the near term. This week will bring the Jackson Hole Symposium, where the markets expect more clues from the FED.
But right now the focus is on the European energy crisis and that does not bode well for the crypto market. At the same time, there has been negative news about Coinbase and other crypto firms, not favoring a continuation higher.
With all these fundamentals in mind, the technical picture is suggesting BTC can continue to weaken towards $20k. Once that support is cleared, sellers can look for profit taking around $19k and $17.8k.
On the upside, we should see Bitcoin breaking above the daily 20 EMA, to confirm this was just an exhausted selling and buyers are eager to enter the market. With so many risk factors now priced in by the market, it’s possible that buyers might have to wait until Friday for a relief rally, based on FED’s chair speech.
ETHUSD (Kraken)
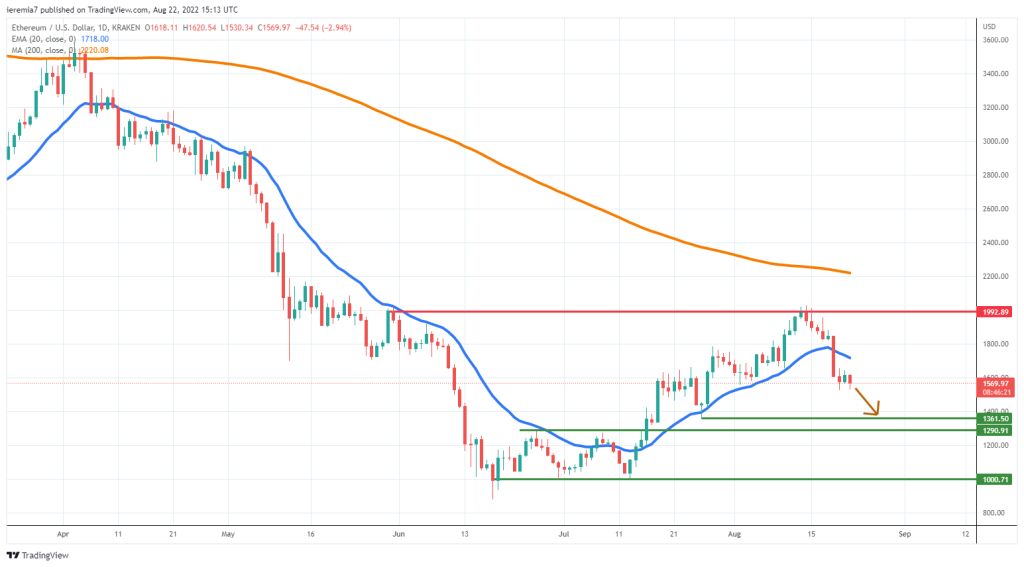
The crypto selloff is broad-based and reached Ether as well, even if this was one of the best-performing tokens. The $2,000 key psychological area acted as a barrier in front of the buying pressure and now we see the price attempting a retest of $1,500. That’s a 25% drop in about a week, suggesting ETH is being dumped aggressively.
That is why we think there’s scope for more weakness this week and the first area to watch is located near $1,300. Several turning points can be seen there and if that’s not enough to cap the downside, then a further slump towards $1,000 is on the cards.
An improvement in sentiment will be signaled by a rise above the daily 20 EMA. If buyers can keep the price above it, ETH can move back towards $2,000 once again.
ADAUSD (Binance)
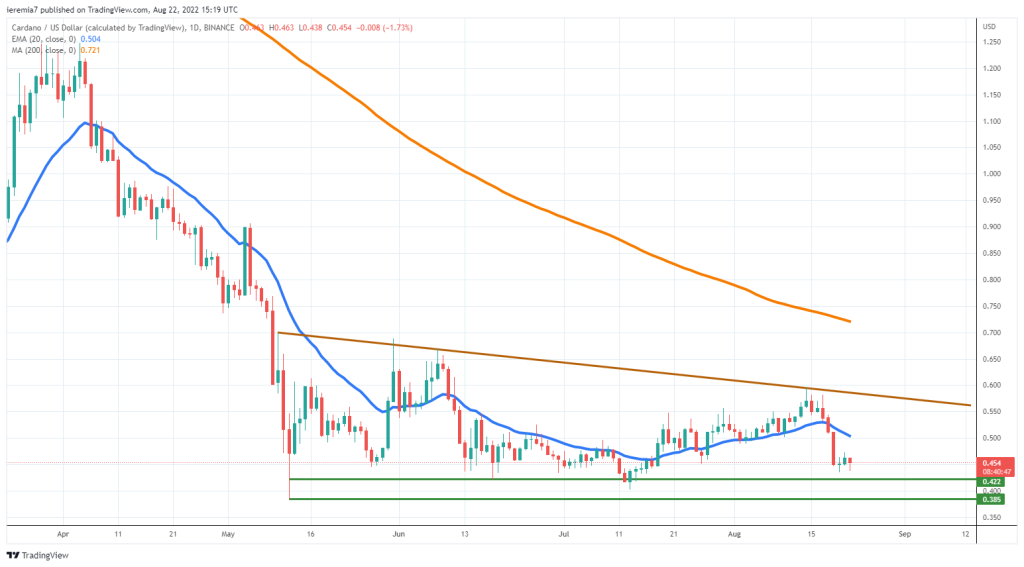
Cardano is down 20% over the past week and when looking at the daily chart, we can easily notice the price is approaching the area around 42 cents and 38 cents. That’s where several bullish corrective moves have started since mid-May, but the most worrying sign is the weakness seen in the upward legs.
ADA is locked inside a falling triangle, which is a bearish price action formation. However, we need to see a clear breakout below 38 cents because that can push the price towards 30 cents. As long as the triangle remains in play, short-term traders can place orders on both sides of the market.
Things could go either way and buyers will resume impulsively only if the price breaks above 60 cents. That’s a 30% rise from the current location and given the lack of appetite for crypto right now, it does not rank as our best-case scenario for this week. Expect more volatility during the following days, unless there will be a major catalyzer for impulsive buying.


There are no comments at the moment, do you want to add one?
Write a comment