
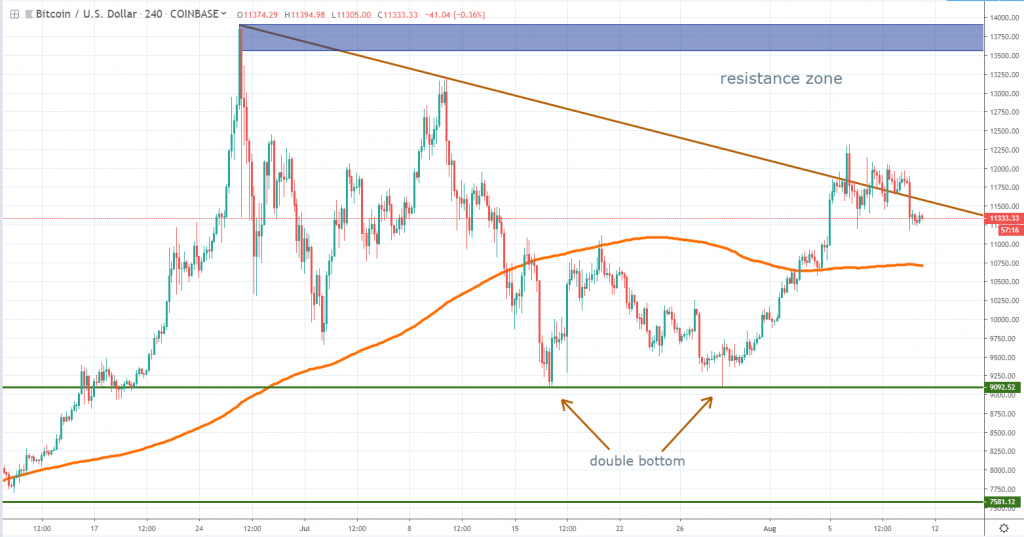
BTCUSD Coinbase
Source: tradingview.com
As we’ve already anticipated, Bitcoin encountered resistance around the descending trend line, with buyers unable to keep the price above it for more than 24 hours. However, the selling pressure seems to be weak, as the last 20+ candles of selling can barely cover less than 8 candles of buying. In addition, we are still above the 4h chart 200 moving average, which means the bulls are still in control.
Looking ahead, we should see how the price action will react around the MA. If a strong breakout will occur, we could see Bitcoin edging lower towards the $9,100 area, where a double bottom occurred in July.
If the buyers will break above the descending trend line impulsively, there could be room for more gains towards the $13,500-$13,900 resistance area, where sellers could rejoin impulsively. Either scenario has a 50% probability from our point, so the best thing to do is to wait to see how the market will move.
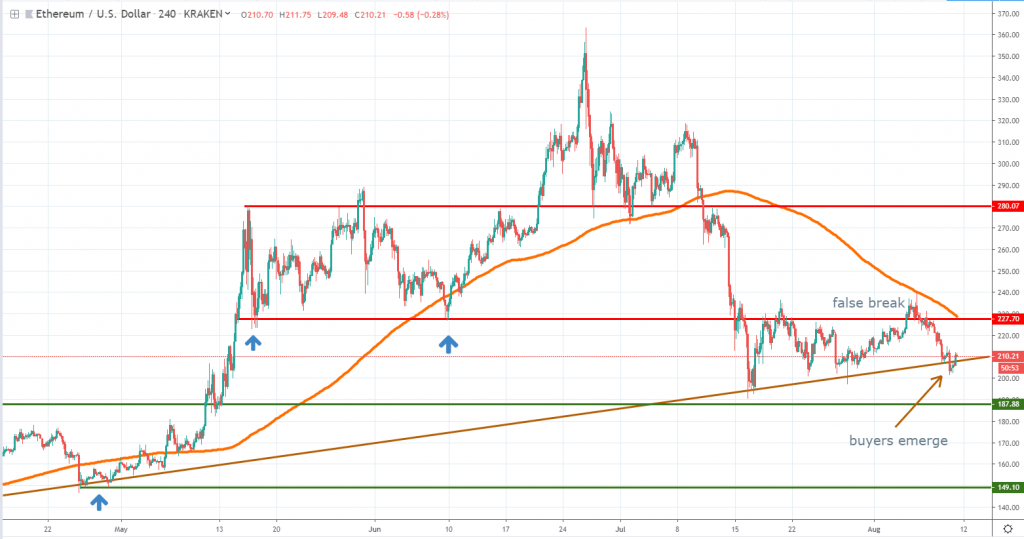
ETHUSD Kraken
Source: tradingview.com
Unlike Bitcoin, Ether is in a much tougher position, as the buyers continue to struggle to keep the price above a trend line that goes back to December 2018. In less than a month we had three retests of the trend line and none resulted in impulsive buying, which might point towards an imminent breakout lower.
Buyers failed to keep the price above the $227 resistance, which is where impulsive selling resumed at the beginning of the week. Continued selling is expected to push Ether towards $187 or even $150, as the overall structure looks bearish parabolic.
If buyers drive the price higher, $227 and the 4h chart 200 moving average would make a hard resistance to break. However, unless that occurs, the prospects for Ether are very bearish and we should expect more losses.
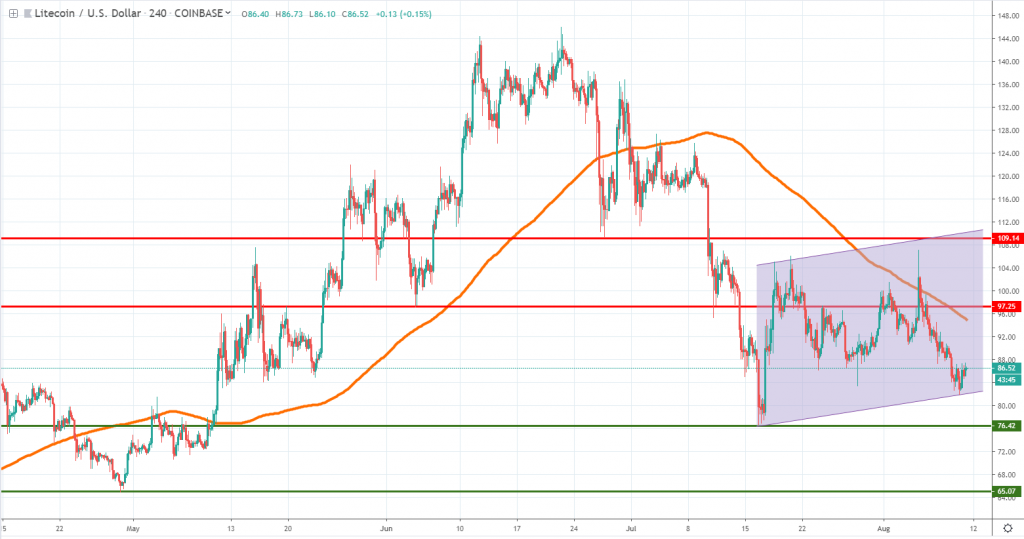
LTCUSD Coinbase
Source: tradingview.com
Since mid-July Litecoin look trapped in a consolidation structure that follows after a very impulsive selling move. The price had been unable to break above the 4h chart 200 moving average, which is a very bearish signal. As we progress, we may see shallow pullbacks towards the 200 MA or the upper area of the consolidation, but at this point, the very likely continuation is on the downside.
The $76.4 and $65 are two important support levels where buyers might look to enter the market. On the other hand, only a breakout above the consolidation structure (meaning above $110) will negate our bearish views and raise the prospects for a recovery. We keep our bias towards the sell-side and expect Litecoin to resume the downside impulsive if it will retest the 4h chart MA again in the next few days.
Briefings about ICOs
There are 20 days left in which AllSesame will raise funds for a Decentralized Social Food Network powered by the blockchain technology. The AllSesame token is a blockchain ecosystem architecturally designed to create the most socialized global food delivery market place.
The AXEL.Network project will run its IEO on August 12th in order to develop a fully operational master node network, bringing the future of the distributed web, fostering a movement from centralized to decentralized systems.


There are no comments at the moment, do you want to add one?
Write a comment