
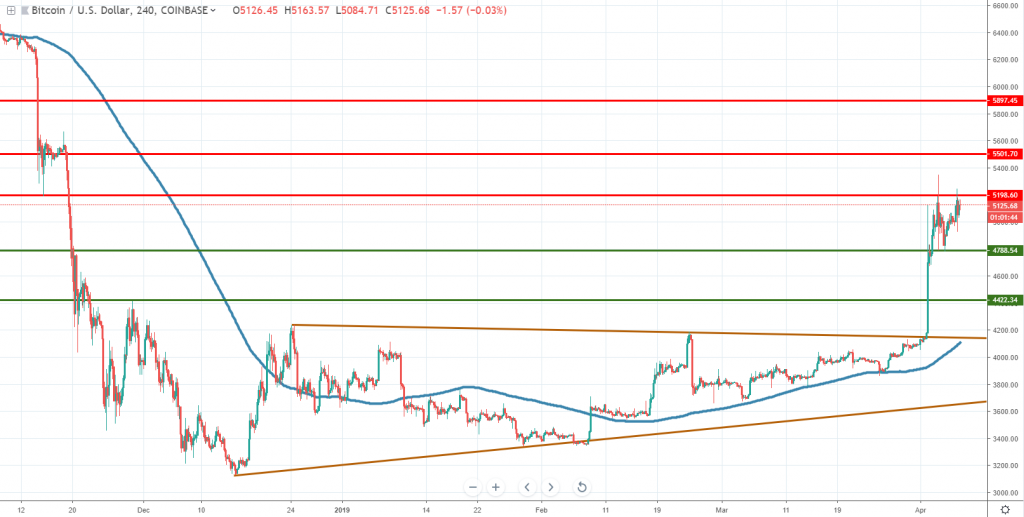
BTCUSD (Coinbase chart)
Source: tradingview.com
The less likely scenario mentioned in our last weekly crypto analysis occurred and what followed is a massive breakout which led the Bitcoin price to a new 2019 high, located around $5,350 on the Coinbase exchange.
At the present time, the price seems to struggle around the November 15th low, but if a continuation higher will follow, we suspect the upside will be capped by either $5,500 or the previously broken floor located around the $5,900 area.
The pullback from the current level could end around the $4,790 area, where bulls had shown signs of activity. Below it, $4,420 looks like the next possible target. The price action had broken above the 200 daily moving average, another important technical aspect, but still, follow-through buying will need to be seen in the following days in order to confirm that this is just the beginning of a larger bull run.
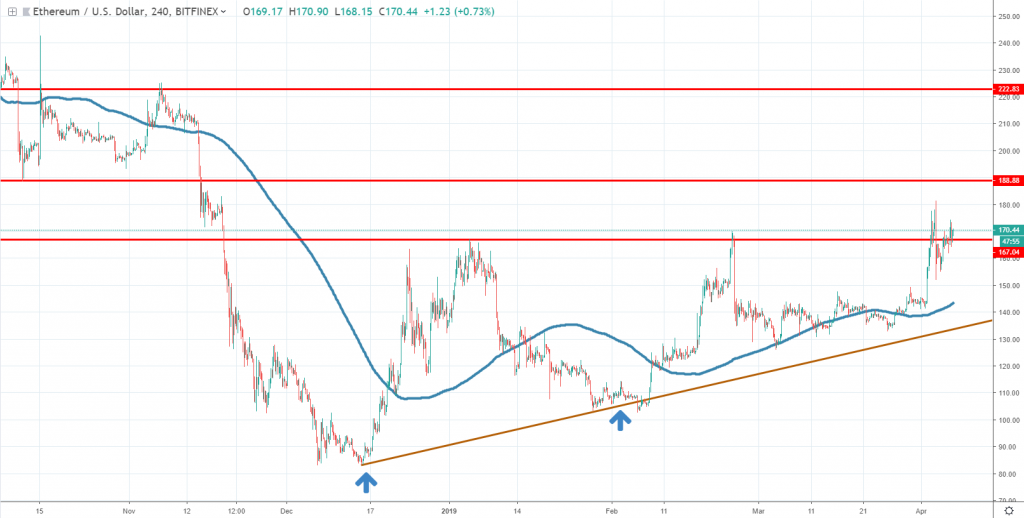
ETHUSD (Bitfinex chart)
Source: tradingview.com
Ether managed to make a new 2019 and at the time of writing there is a tug of war going on around the key $167 resistance area. A nice ascending triangle started to unfold since mid-December and right now the buyers look set to continue pushing the price above the structure.
If buyers will be able to push the price above the current 2019 high, we suspect that next possible targets are located around $188 or $222 in the medium-term horizon. A false breakout formation is still possible, although a new yearly high had been made.
In case the $167 resistance area will hold, and the upside will be capped, we suspect a deeper retracement lower might follow, potentially heading towards the 4h chart 200 moving average or the lower line of the triangle.
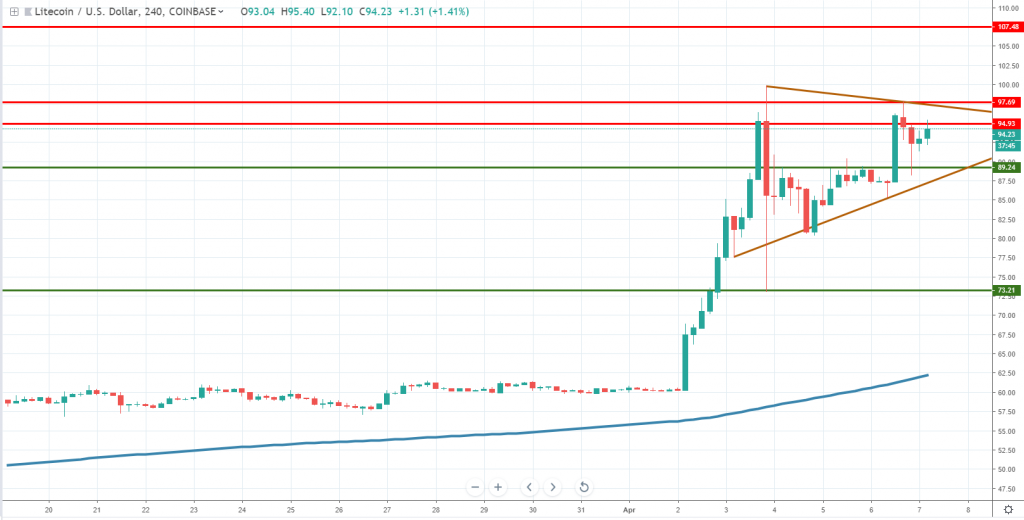
LTCUSD (Coinbase chart)
Source: tradingview.com
Driven by the Bitcoin massive breakout LTC had also jumped impulsively from $60 to almost $100. For the past few days, the price action had been consolidating inside a triangular formation, but we suspect there’s little upside left.
The bullish move stalled around the $95-$97.6 key resistance area and a massive bearish engulfing candle can be seen on the chart. We think LTC is likely to break the triangle on the downside and head towards the $73.2 area, where it found support on April 3rd.
On the other hand, in case of a break on the upside and follow-through buying above the key resistance zone, we could see LTC heading towards $107 or $110 levels. At the time of writing, buyers are attempting a new breakout and it will all depend on whether they will manage to do it, or not.
There’s no important news supporting the surge in cryptocurrencies, which makes the upside very sensitive.
Briefings about ICOs
Nodvix is a project currently raising funds in order to develop the world’s first 24-hour video broadcasting platform build on Ethereum. It is a self-regulated solution, providing an honest division of income to all participants, and it will raise funds until April 10th.
In terms of upcoming ICOs, Quanta Network is a very interesting project, which aims to develop a scalable and secure blockchain platform for the telecom industry. Its ICO will start on April 15th.


There are no comments at the moment, do you want to add one?
Write a comment