
BTCUSD (Coinbase)
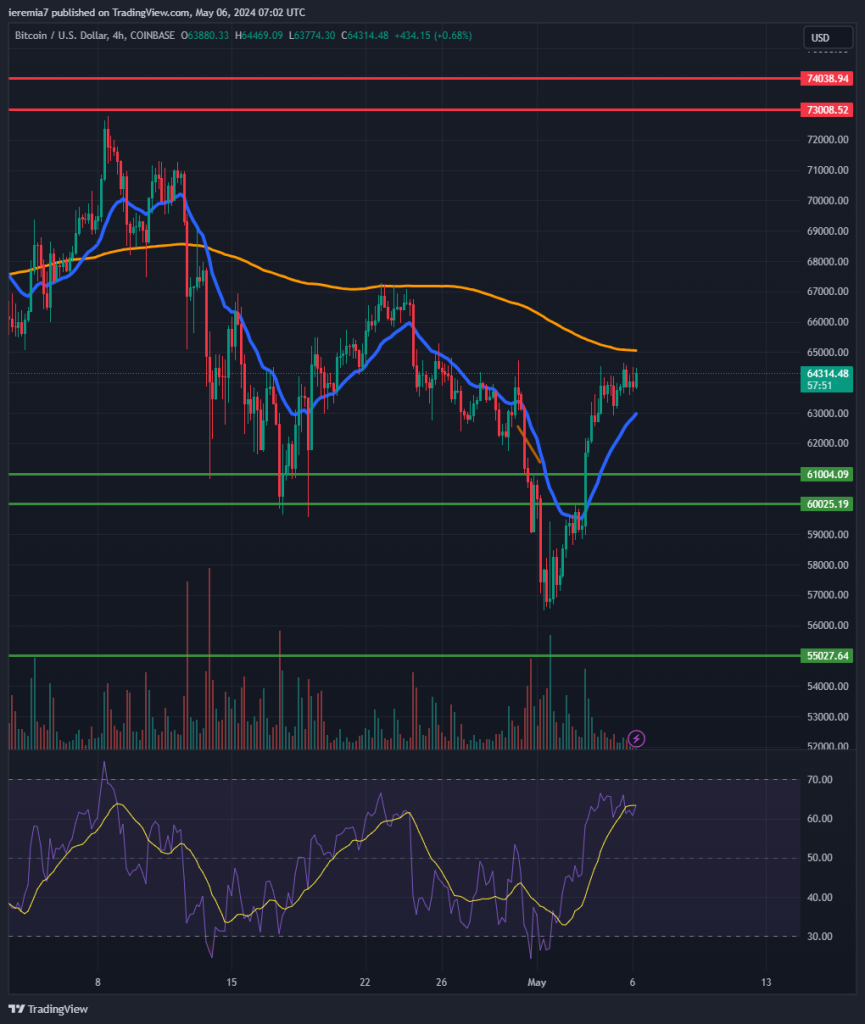
Although Bitcoin briefly broke below the $60k area, the FOMC turned out to be more dovish than the market expected. That acted as a tailwind for risky assets and we can see how Bitcoin benefited as well.
We are bullish short-term, as long as the price stays above the $60k – $61k area. Additionally, when zooming to the 4h chart, we can see that BTC hasn’t breached above the 200 SMA. Volumes have been rising and the RSI rebounded from oversold conditions.
The next thing we need to see is sustained buying, showing confidence from market participants that the move has legs. Once above the 200 SMA, our upside target will be $73k, with potential to even move to a new all-time high.
Even though May is not the best month for Bitcoin from a seasonal standpoint, technicals favor the bulls. Still, that doesn’t mean we should rule out renewed selling. We will turn bearish if the market breaks and holds for a longer period below $60k. That will show weak buying interest and an advantage for bears.
ETHUSD (Kraken)
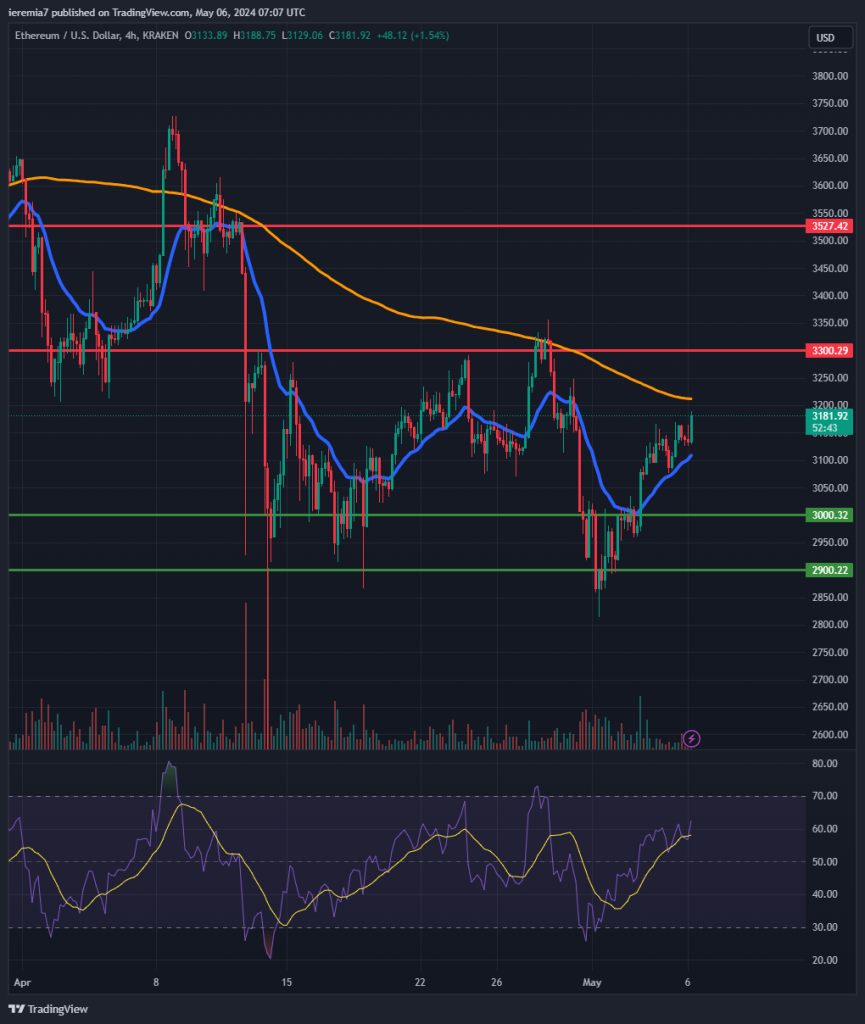
Some selling can be seen in ETH as well in the first half of last week. However, buyers resumed impulsively after a brief break below $2.9k and now the sentiment is more positive. Looking at the broader picture, the coin seems to be forming a bottom after the flash crash that occurred on April 13th.
Despite the obvious choppiness, we think this is healthy for the overall trend and dips should be bought in this market. We are noticing a pocked of resistance as we get close to the $3,300 area. The 200 SMA shouldn’t be ruled out as well, given it acted as a selling zone several times since a month ago.
Clearing $3,300 will be encouraging for bulls and that will put $3,500 on the cards. We expect less volatility this week, given there aren’t major risk events that might impact the crypto space. However, our risk-off signal is a breakout below $2,900 and no reaction from the bull-side.
SOLUSD (Coinbase)
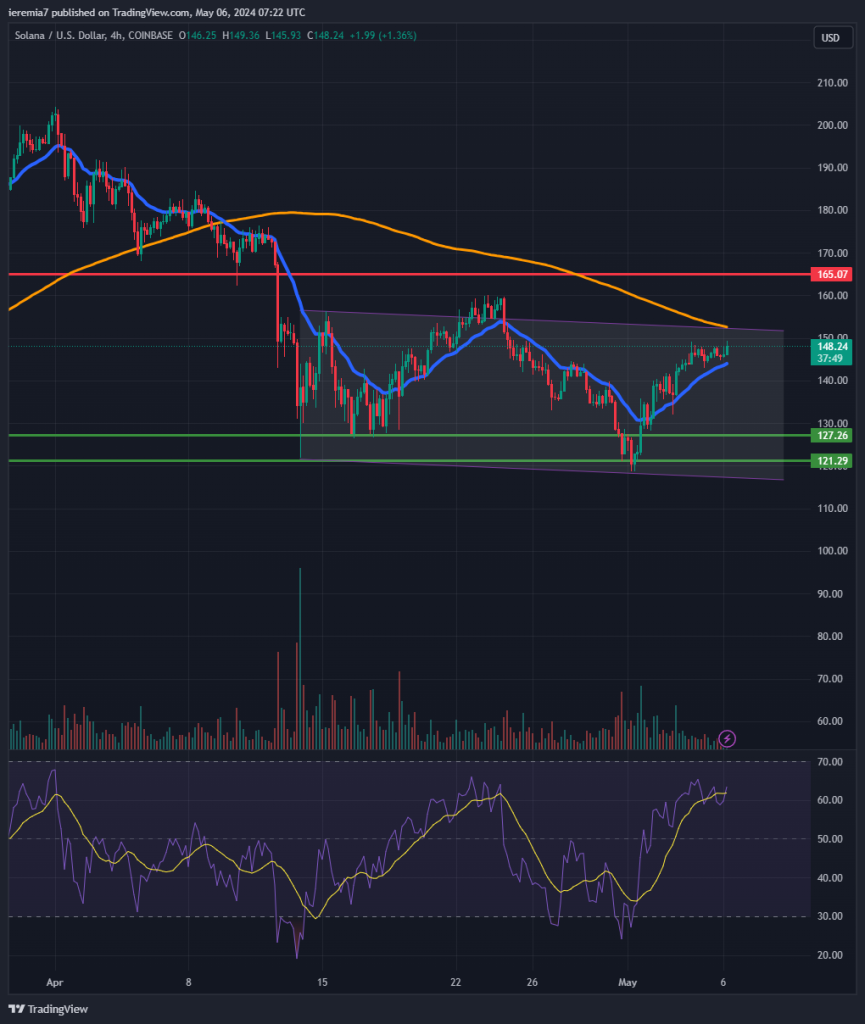
Solana looks to be bottoming after a pretty serious drawdown. We can see from the chart how the $121 – $127 area acted as a solid support for the second time and this time around, the reaction from the bull-side seems to be stronger.
That’s a strong hint for a change of hands and there could be more upside waiting to be unlocked. Until then, buyers should remain cautious, because the price might get choppy as it reaches the 4h chart 200 SMA and the $165 key resistance level.
A break and hold above $165 will mean the bottoming is complete and SOL could extend toward $200 over the upcoming weeks or months. Our bullish scenario will be negated if the price breaks impulsively below $120 and fails to rebound in force. That will mean buyers have lost interest and will wait for a deeper move lower before considering to increase SOL exposure.


There are no comments at the moment, do you want to add one?
Write a comment