
BTCUSD (Bitstamp)
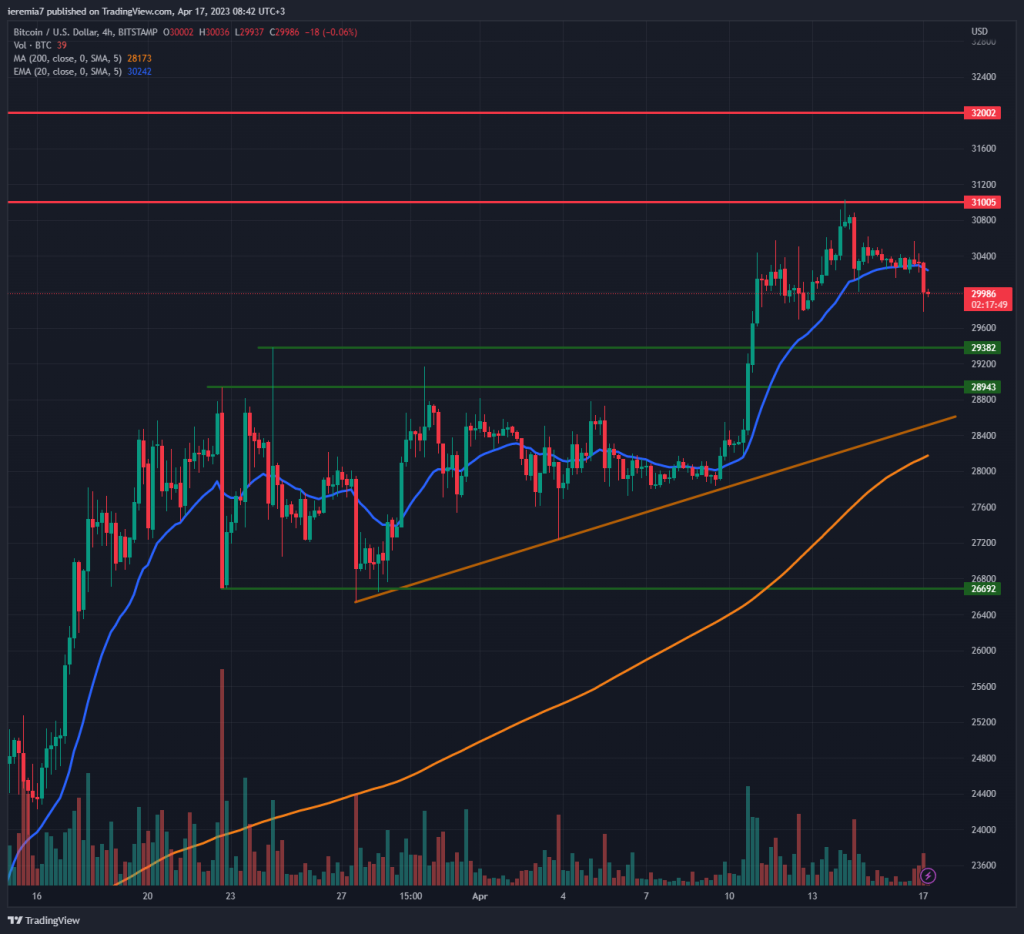
Bitcoin’s price continued to rise last week, but not at the same impulsive pace. We can see how the $31,000 area acted as resistance and since then, BTC broke below the 4h chart 200 EMA. Selling volumes picked up a bit, which means the market is cautious, which should be no surprise given the impressive run higher.
US 1-year inflation expectations shifted up on Friday, triggering a tightening of financial conditions across the board. As we are getting close to the end of the month, we favor more sideways price action and consolidation at best. For that to be negated, Bitcoin should start breaking up and take out $31,000 in order to head toward $32,000.
If the selling continues, traders should watch $29,300 – $28,900 as the closest support zone. If that holds and buying resumes, we might be witnessing a breakout and retest pattern, which is bullish for Bitcoin. Conversely, large red candles and no sign of bullish interest should be a warning sign and BTC could be headed toward $26,500.
ETHUSD (Kraken)
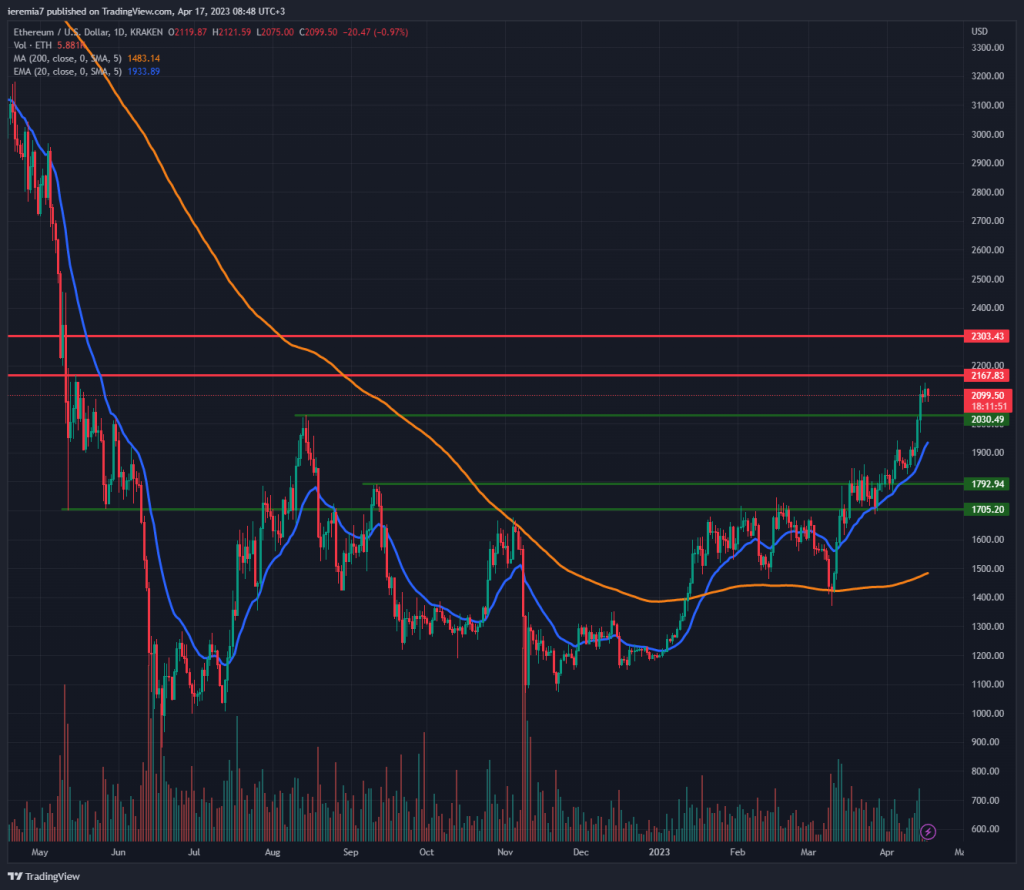
While Bitcoin had a rather muted performance last week, Ether managed to continue extending higher, posting larger gains. The price cleared the major $2,000 resistance zone and that should be treated as support from now on. If the move persists, traders need to look at $2,160 as the next significant resistance.
Be aware that’s an important inflection point and large selling orders are parked around it. However, if sellers did not manage to deliver, ETH should be able to continue its run up toward $2,300. We advise buying on dips now that the price moved further away from the daily 20 EMA.
The broader picture now looks more bullish, considering the price broke above the August 2022 high. This is a legit bottoming formation; only an impulsive break below the daily 200 SMA and $1,500 can negate it. We suspect there will be strong bullish interest if Ether manages to keep above the 20 EMA.
SOLUSD (Coinbase)
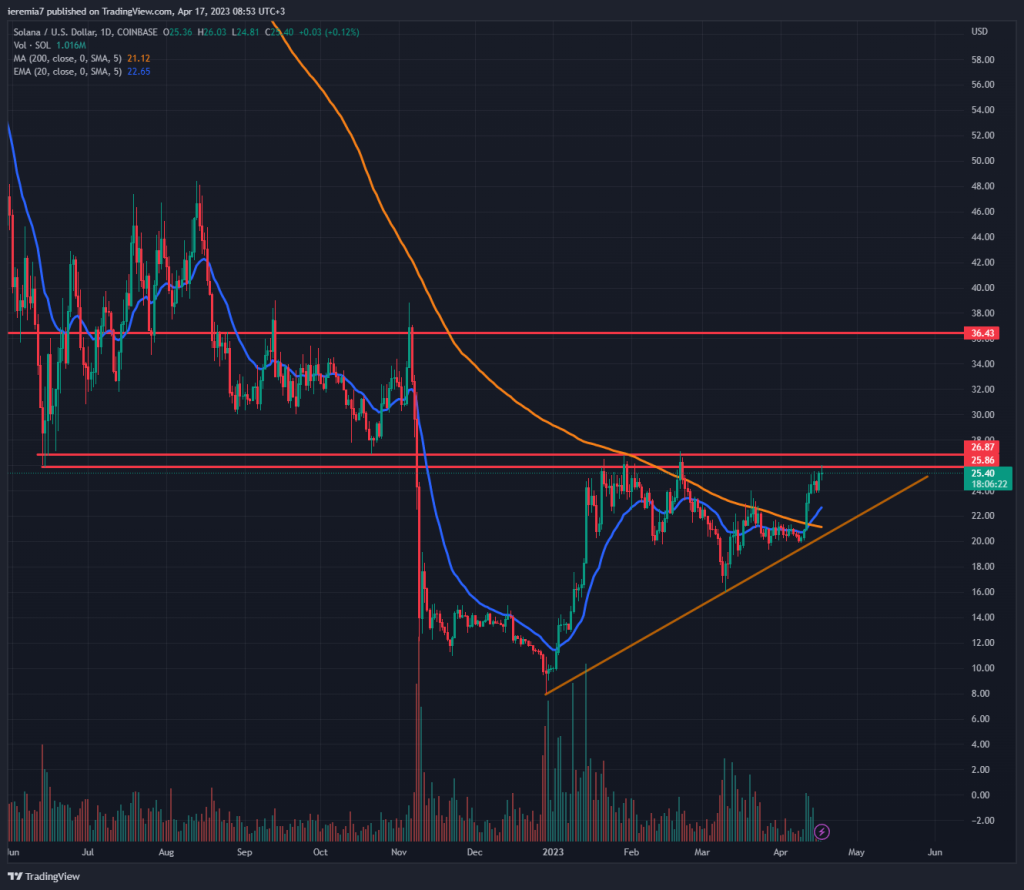
Solana is posting 25% gains over the last 7 trading days and when looking at the chart, the picture improved for buyers with the breakout above the daily 200 SMA. Despite the impressive gains, we now see SOL close to $26-$27, which is a major resistance zone. Buyers need to clear it along with the January 2023 highs because in that scenario, we believe more bids will come into the market.
In case this turns out to happen, the upside target shifts toward $36. That’s where the November 2022 selloff started and it can be a good opportunity for bulls to take some gains off the table.
The bearish scenario should not be neglected and if SOL encounters resistance around $26, the daily 20 EMA and then the 200 SMA + an ascending trend line are expected to cap the downside. Failure to do that creates a lot of issues and could push the price toward $15. At this point, it looks unlikely, but we know sentiment could shift in a blink.


There are no comments at the moment, do you want to add one?
Write a comment