
BTCUSD (Coinbase)
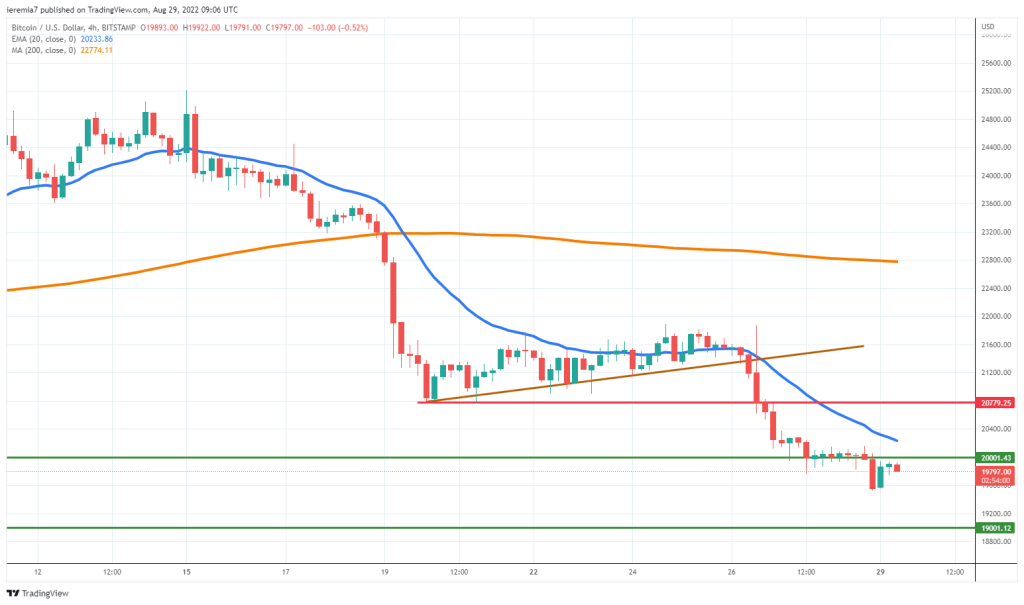
The FED’s chair speech at the Jackson Hole Symposium was a real drag on risk assets and even Bitcoin suffered as a result of the hawkish stance. Central banks aren’t willing to show any sign of pivot, so in the meantime, there is nothing to support current valuations.
Bitcoin dropped below $20,000 again and that does not bode well for the overall sentiment. The only minor positive development is the sellers being unable to push the price further below. It’s still just Monday, however, and more pain might be seen in the following days. Further selling can drive BTC towards $19,000 and from that point forward, current yearly lows are under threat.
An improvement of sentiment will be signaled by a push above the 4h chart 20 EMA. After that, buyers can encounter resistance around $20,700, which is the August 19th low. Based on current conditions, sellers are still in control and until the technical picture improves, there’s no point to try and catch a falling knife.
ETHUSD (Kraken)
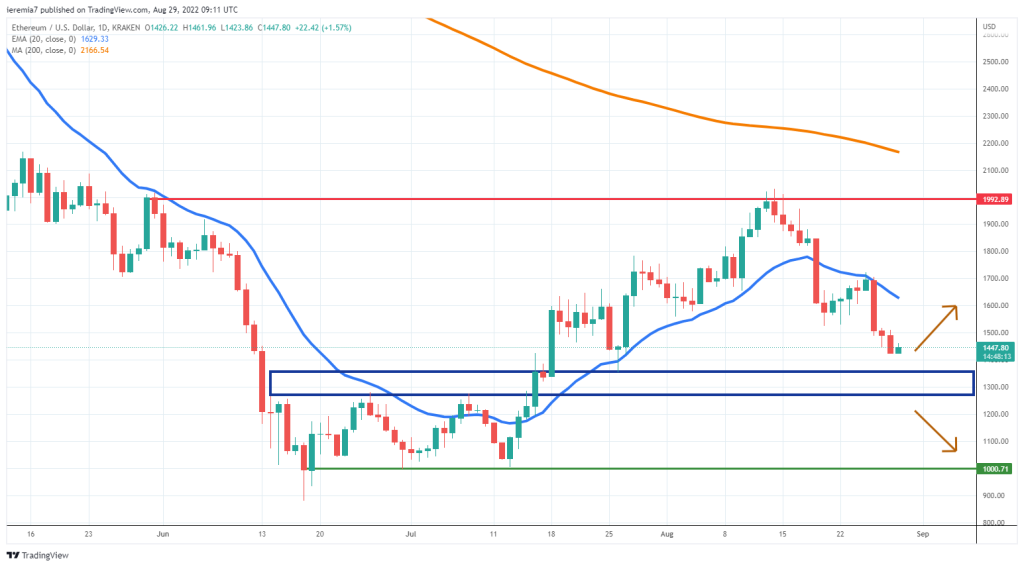
Similar conditions can be spotted in Ether, the second major cryptocurrency suffering from aggressive selling. Looking at the daily chart, green candles are small and pale in comparison to red candles, meaning the order flow is heavily biased towards the sell side.
It seems $2,000 acted as a strong resistance, in line with our expectations, but as the risk sentiment deteriorated further, the coin dropped 25% from the highs reached on August 14th. The line in the sand is located around $1,350 – $1,200. If that’s not enough to cap the selling, Ether can move further below towards $1,000, where it bottomed at the beginning of summer.
On the other hand, buyers starting to balance the equation around that area will be a positive sign and might be indicative of more buying along the way. In that situation, the daily 20 EMA should be retested. Breaking and holding above it should encourage more bids, but we need to see risk sentiment improvement across the board for that to happen.
SOLUSD (FTX)
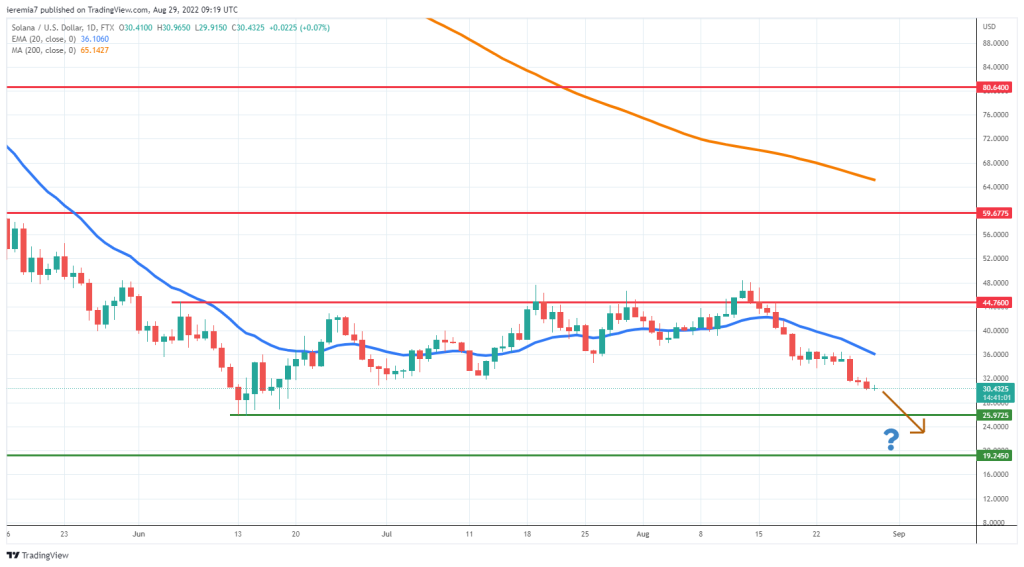
Solana suffered from heavily selling for the past two consecutive weeks, erasing the modest gains banked since mid-June. The impulsiveness of the bearish move is worrisome, given it now threatens to break below the June lows, a negative technical development that should incentivize more selling afterward.
That did not happen yet, but traders who are looking at Solana should monitor closely how the price reacts in case $26 will be reached again. Failure to prevent a close below that level will be a sign for a continuation lower and $19 should be on the cards.
The upside seems capped by the daily 20 EMA, so until we see a material break above the blue line, there’s no point to try and anticipate the bottom. Even if a period with positive crypto seasonality is approaching, patience is still advised, mainly because this is another year of negative performance for digital assets.


There are no comments at the moment, do you want to add one?
Write a comment