BTCUSD (Bitstamp)
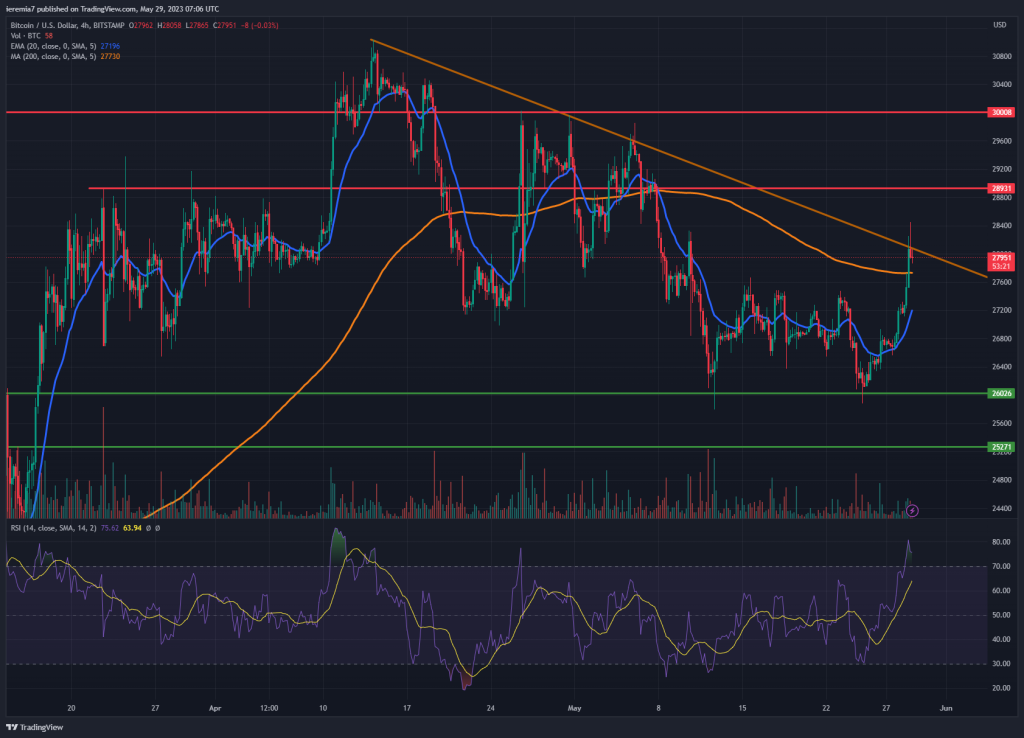
The market mood improved substantially since Thursday last week and now we see Bitcoin attempting a breakout above a trend line that goes back to mid-April. Since then, this coin has been retracing lower, but now that the uncertainty around the US debt ceiling is over, traders have been piling into risk assets.
Moreover, tech stocks have been outperforming by a large, so it’s no surprise to see cryptos starting to move higher. As we head into the end of the month, we would not rule out choppy performance. A continuation higher would need a break above the trend line first. If that’s the case, then our upside targets will become $29,000 and $30,000.
Bitcoin has been late to the party, so we believe the scope for massive upside potential is limited. In case the price breaks impulsively below the 4h chart 200 SMA, expect a retest of $27,000. The momentum is clearly favoring bulls right now and any dips should be bought by buyers eager to join the move up.
ETHUSD (Kraken)
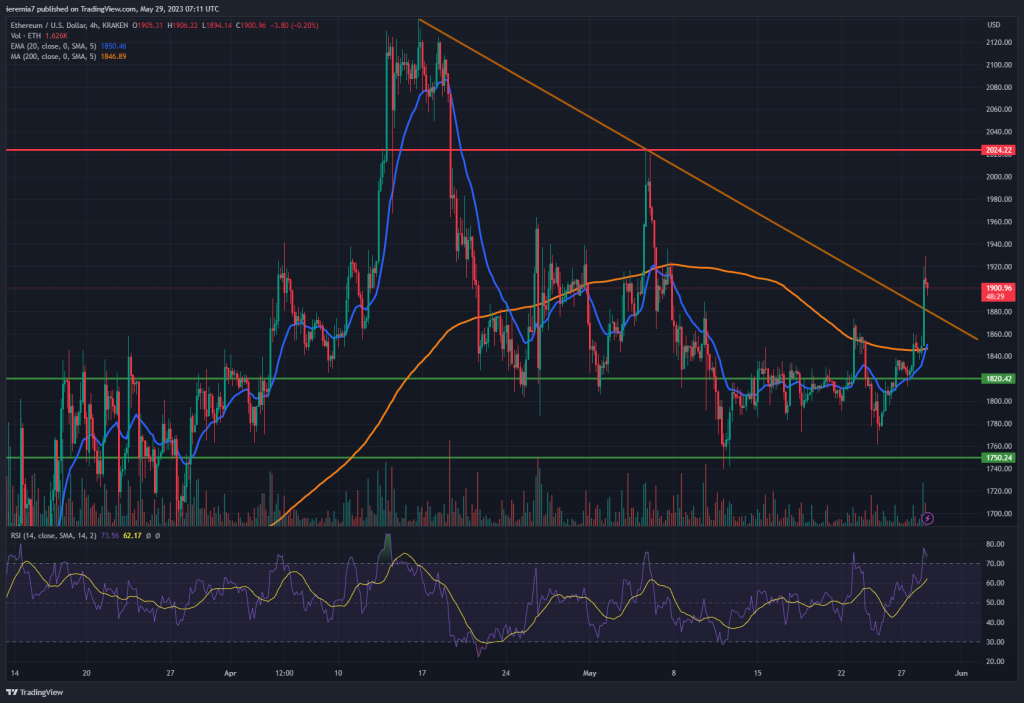
Similar to Bitcoin, Ether also had to stumble into a trendline, but in this case, we see the price already trades above the orange line. This shows ETH is outperforming and could post stronger gains if the move continues to extend higher.
Traders should remain cautious since dips below the trend line are possible. However, if the market starts to treat it as support and then the price rotates higher, it would be an early indicator for a new leg up. In this scenario, we treat $2,000 as a major resistance zone. Above it, the current 2023 high near $2,100 would also matter after that.
The bearish scenario shouldn’t be ruled out and for that to happen, we need impulsive selling and ETH to break back below the trend line and the 200 SMA. The price is vulnerable to short-term weakness because the RSI is trading in overbought territory. That could continue for a while, but it just reinforces the fact traders will be better positioned if they enter the market after a corrective move lower.
ARBUSD (Coinbase)
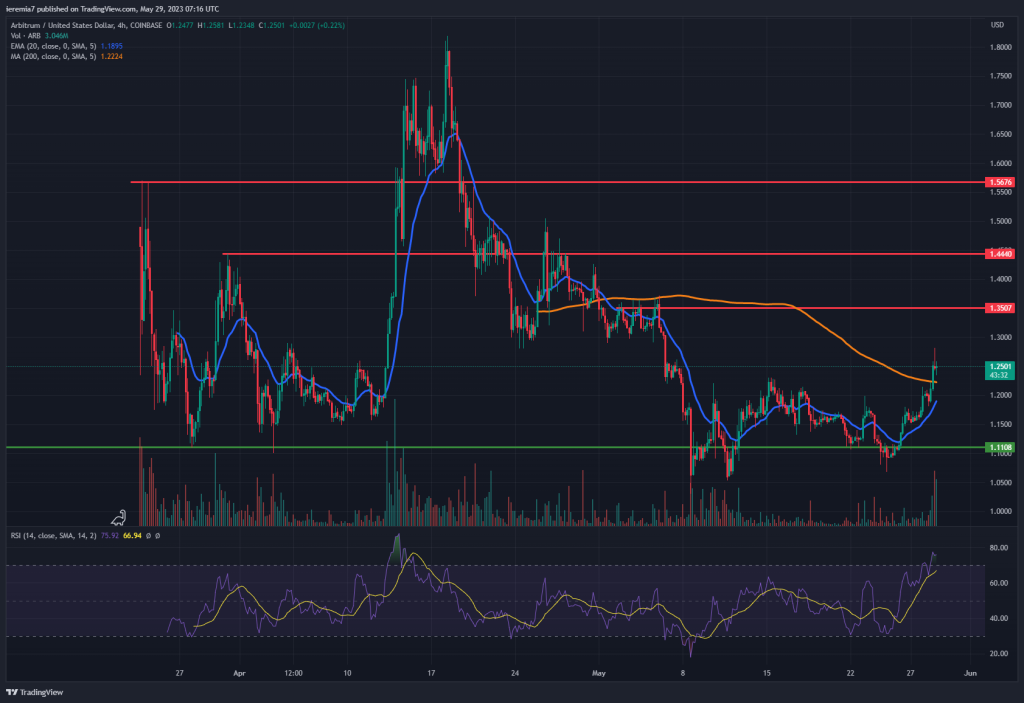
Arbitrum is a relatively new name on the Coinbase exchange, but what’s interesting is that the coin managed to outperform the broader market last week. Up over 11% in less than 7 days, it’s well positioned to head higher, in case the bullish momentum persists.
The break above the 4h chart 200 SMA is an encouraging sign and might indicate a continuation towards $1.35, our first key resistance zone. Above that, $1.44 and $1.56 follow, but be aware these are mid-term targets.
After bottoming around the April lows, the buyers seem confident to pile into ARB. The price is nicely heading up in a parabolic fashion, a powerful technical setup that generally overextends in the direction of the trend (up, in this case). Only a breakout below $1.1 could negate our bullish views, but that looks like a low-probability scenario right now.


There are no comments at the moment, do you want to add one?
Write a comment