
BTCUSD (Coinbase)
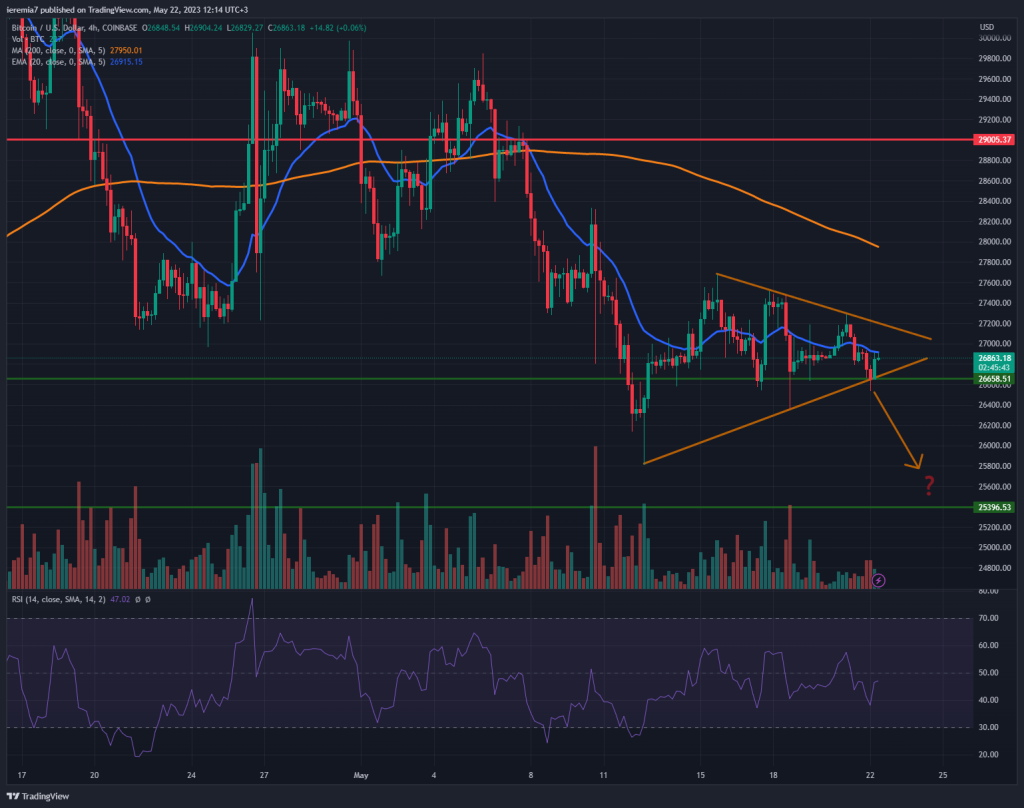
We’ve seen Bitcoin volatility continuing to compress over the last week and now the price is locked into a short-term triangle pattern. Naturally, the direction of the breakout could dictate where the price is headed next and as a preliminary assumption, we give a slight edge to sellers.
Although stock markets continued to move up last week, Bitcoin remained muted. If we start to see cautious risk, then it’s very likely this coin will post larger losses. If that scenario materializes, we believe the $25,400 – $25,000 is a key support zone to watch. Buyers should react strongly around it wanting to catch attractive valuations.
On the upside, the first sign of improvement would be a break above the triangle. After that, the market’s attention will shift towards the 4h chart 200 SMA currently trading around $28,000. Once above that orange line, we can start to consider $29,000 and the key $30,000 level. Thus far there are little signs of buying resuming, so we expect Bitcoin to weaken further as the month of May comes to an end.
ETHUSD (Kraken)
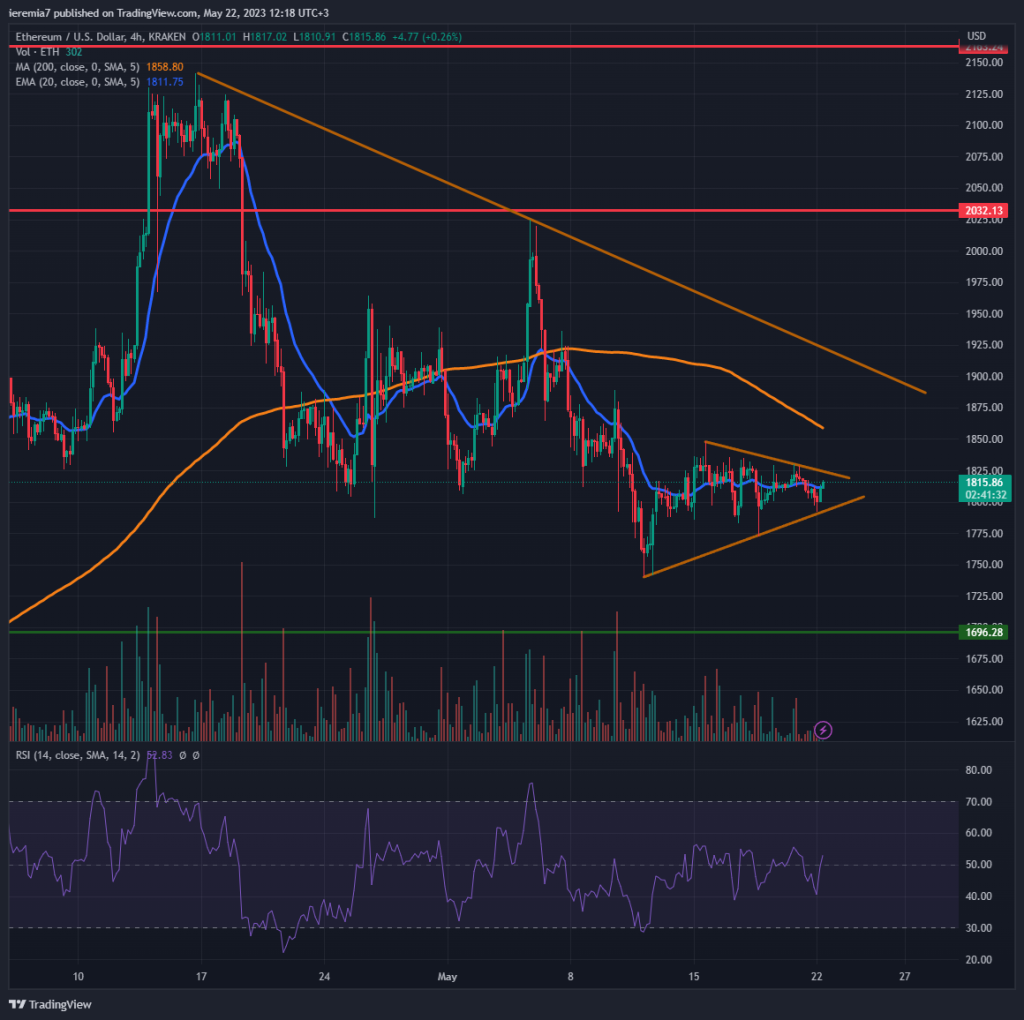
We can see a similar pattern in Ether, where the price has also generated a triangle. Same as with Bitcoin, there’s a slightly higher probability the price can move lower, given the technical conditions are favoring bears, not bulls.
ETH has been weakening since mid-April, generating lower lows and lower highs. That’s not an encouraging sign and until the pattern breaks, sellers are the ones in control. Breaking below the triangle will be an initial trigger for further selling. If that happens, our $1,700 downside target will be back into play.
In case buyers manage to surprise with an upside break, we would like to expect to see what happens once Ether touches the 200 SMA. Moreover, it’s important to break above the falling trend line we’ve plotted on the chart to suggest the sentiment clearly shifted toward the buy side.
XRPUSD (Bitstamp)
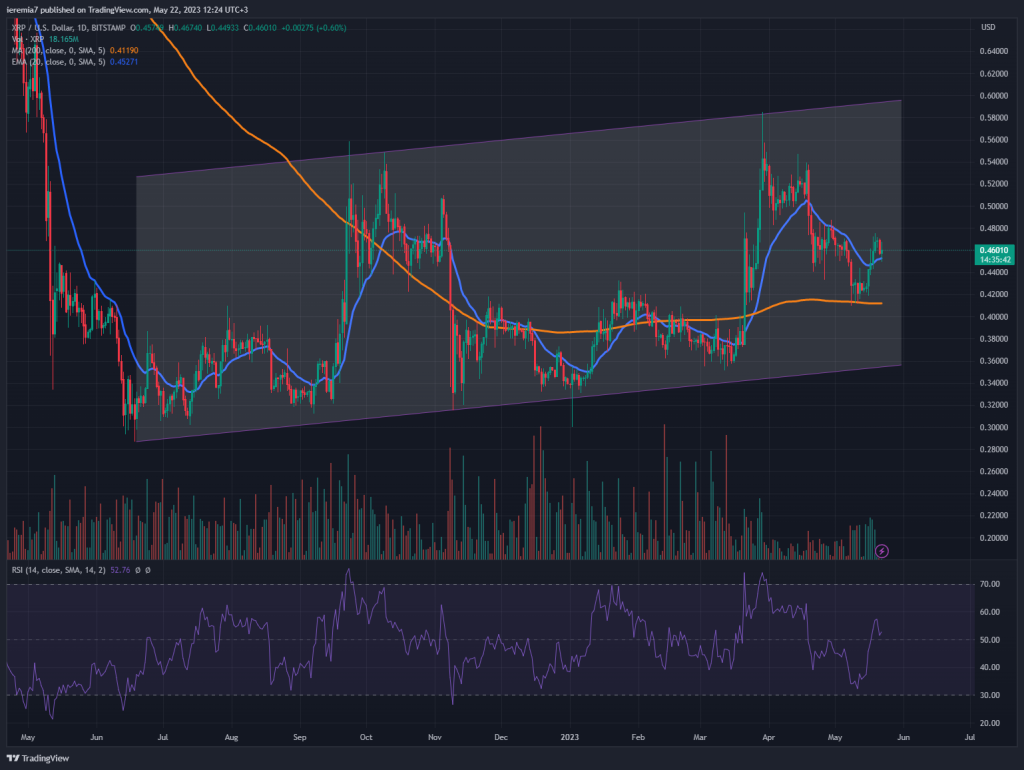
It’s been a while since we’ve last covered XRP, but the coin managed to outperform last week, up around 7%. When looking at the chart, we can see the price reacted to the daily 200 SMA, yet the broader picture remains choppy.
The chop started in July last year and since then XRP moved inside a slightly ascending channel. Moreover, the upper side of the channel was rejected hard each time, which is why we believe there could be scope for further selling. As a result, traders can expect a break below the 200 SMA and a retest of 36 cents, which is where the lower line of the channel is currently located.
Failure to break below the 200 SMA might indicate a short-term bottoming and in that case, it’s possible to see XRP heading towards 60 cents. Conservative traders should wait until the price moves closer to either side of the channel because that’s where they can reduce risk and maybe catch a turning point.


There are no comments at the moment, do you want to add one?
Write a comment