BTCUSD (Coinbase)
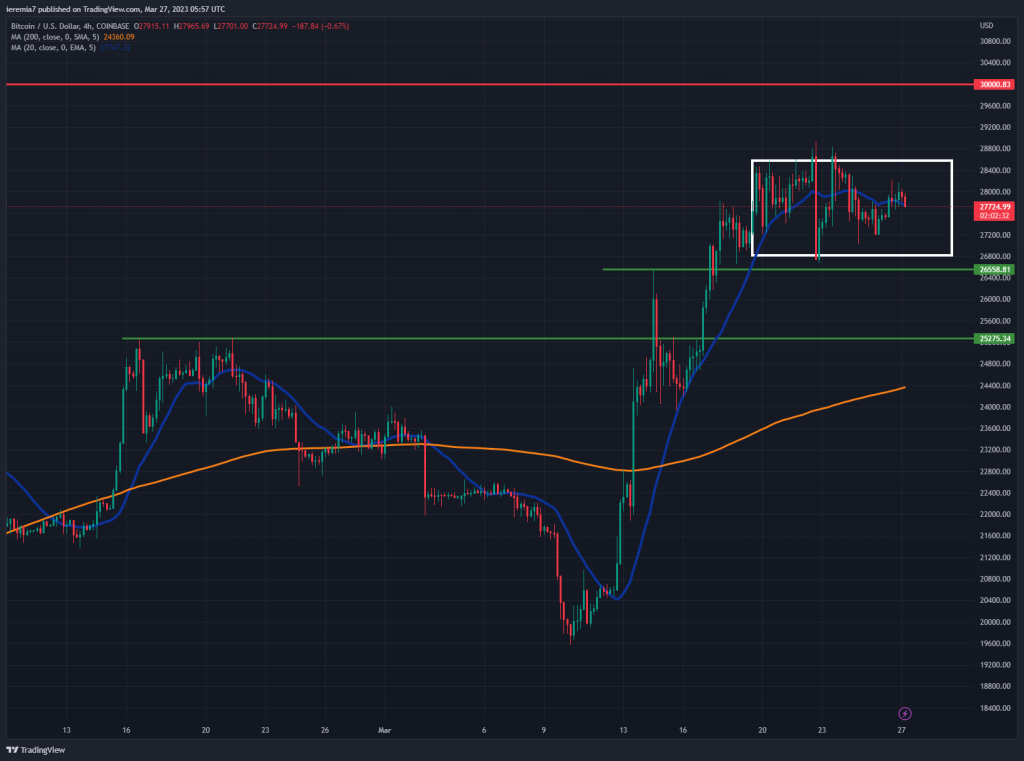
Bitcoin bulls took a break last week and we can see from the chart how the price has been consolidating between $28.6k and $26.8k. Such ranges after an impulsive move higher are normal and could suggest the market is just taking its breath until a new push higher starts to unfold.
Because of that, we believe the lower line of the chart is an area of support where bulls will be interested to increase long exposure. If we see that happening, the first upside target is the top line of the range. Breaking above last week’s high means BTC has a clear road ahead and $30k is the meaningful resistance area to watch.
Traders should be aware that we are approaching the end of March and flows might get choppier. Also, Bitcoin managed to outperform even stocks and that calls for some caution until we see the market grinding higher again. While other markets sold off due to uncertainty around the banking sector, the crypto market seems to have benefited from such developments.
ETHUSD (Kraken)
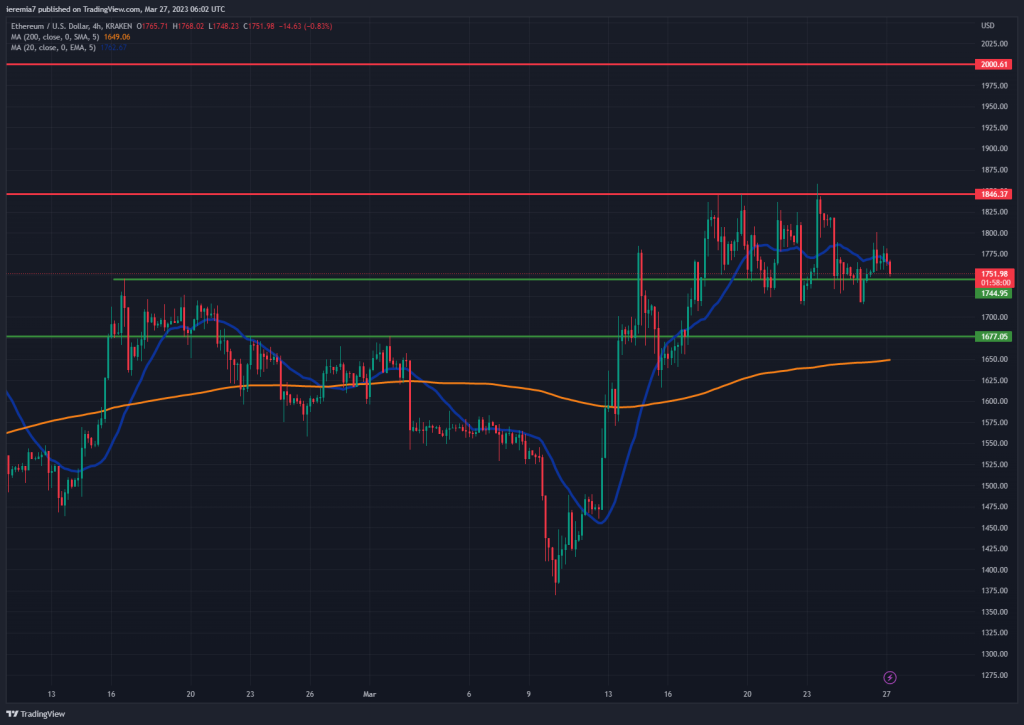
The positive correlation with BTC continues since ETH has also been consolidating for several days in a row. In this case, the $1,750 prior swing high is acting as support in the face of decent selling pressure. Thus far, buyers managed to hold the lines, yet if that area fails, we think the corrective move might extend towards $1,670.
Shorting this market at this point is tricky, because a new impulsive round of buying can put sellers into a bad position. On the flip side, bulls can wait until the price gets closer to the support area + the 4h chart 200 SMA. That should be a strong support zone.
On the upside, resistance can be found near $1,850. If the market breaks last week’s high, our next upside target shifts towards $2,000. That’s a psychological area where selling interest has the potential to spike.
XRPUSD (Bitfinex)
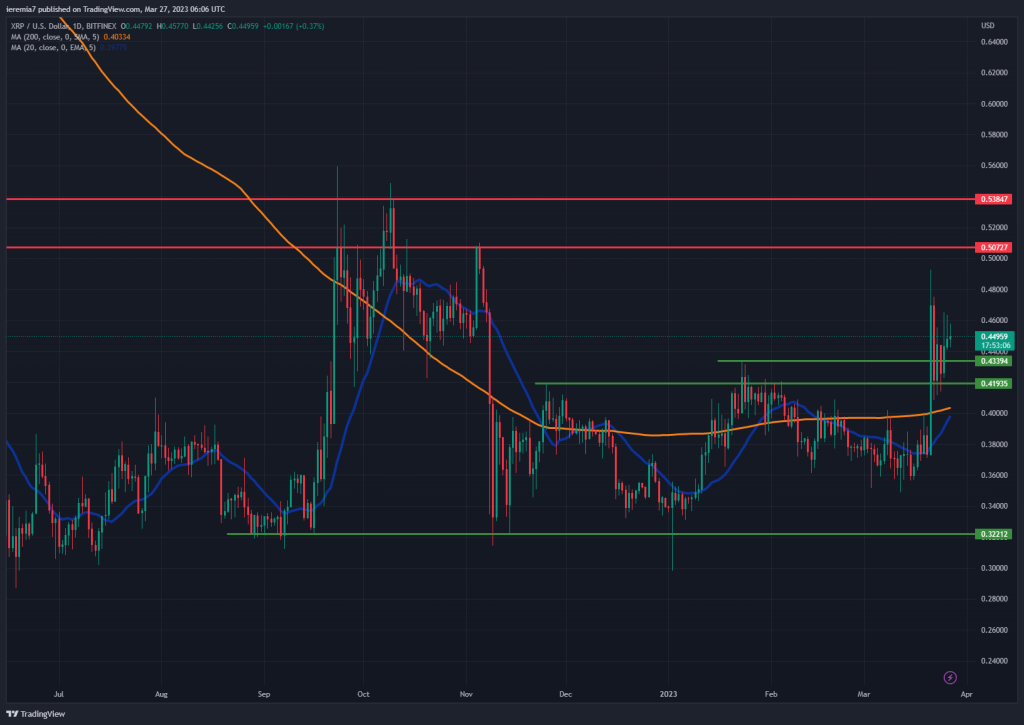
It’s been a while since we last talked about XRP, but last week the token posted an impressive +17% gain. Looking at the chart, we can see how it broke above the key resistance area around 44 cents and since then, buyers have been pushing the coin higher. This is a classic breakout and pullback setup, meaning more gains could be seen in the near term.
Due to favorable technicals, we suspect XRP can move higher and the resistance levels to watch at 50 and 53 cents. Those are places where the price retraced sharply and history could repeat itself. The bearish scenario implies that XRP should break below the 200 SMA impulsively.
Even if that happens, the price still needs to continue lower and break the 35 cents support area as well. Looking at the bigger picture, we can say that the coin is locked in a range between 53 cents and 32 cents. The momentum is currently pointing up and we expect a retest of the upper side of this structure.


There are no comments at the moment, do you want to add one?
Write a comment