
BTCUSD (Coinbase)
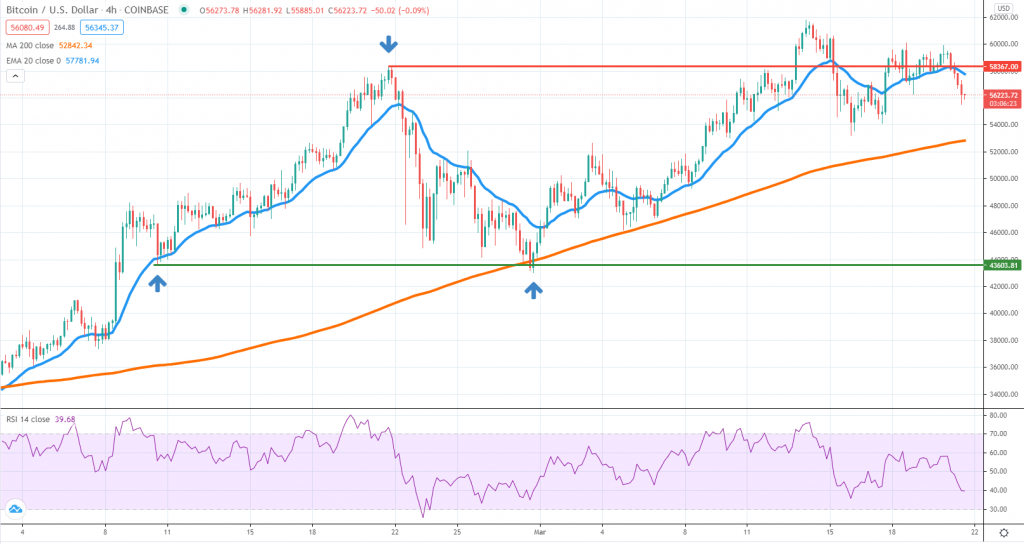
Even though a week ago conditions were favorable for a continuation higher, Bitcoin failed to do that. Rising US dollar combined with news from India potentially preparing a ban on crypto use had deteriorated the sentiment and BTC dipped below $58.3k, a key role reversal level.
Since the price is now trading below the line after treating it as resistance, the short-term sentiment shifted to slightly bearish. As a result, we think there is an increasing probability for a continuation lower, towards the 4h chart 200 SMA. If the selling continues below it, that might signal Bitcoin is trading inside a range, with the lower side of the structure located around $43.6k.
To have a change in sentiment, it is imperative to see the price breaking above $58.3 and then treating it as a support, in case sellers try to drive it back lower. For now, that’s the least likely scenario, as buyers seem to have taken a break, but as seen many times in the past, conditions can change pretty fast.
ETHUSD (Kraken)
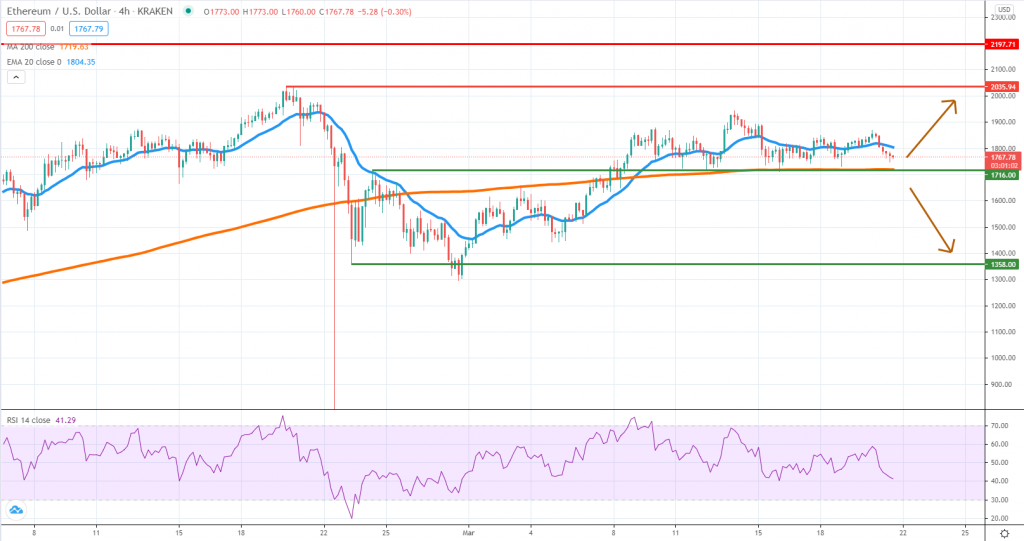
The Ether price also settled during the past week and even though buyers were unable to drive it higher, technical conditions are much better, as compared to Bitcoin. That happens because, ETH continues to trade above $1,700, and the 4h chart 200 SMA, two support levels that if not breached, could as an optimal entry point for buyers.
This is a pretty straightforward technical setup, meaning the ETH sentiment is bullish while above and it can shift to bearish, in case a breakout will occur. In terms of our upside targets, the $,2000 area continues to a key psychological zone to watch. An impulsive break above it will signal bullish continuation.
On the other hand, if ETH will start to roll over in the upcoming days, the likelihood for a corrective move towards $1,350 increases. Volatility is now contracting, which is why traders need to be cautious for any spikes as the new week’s trading activity increases.
LINKUSD (Kraken)
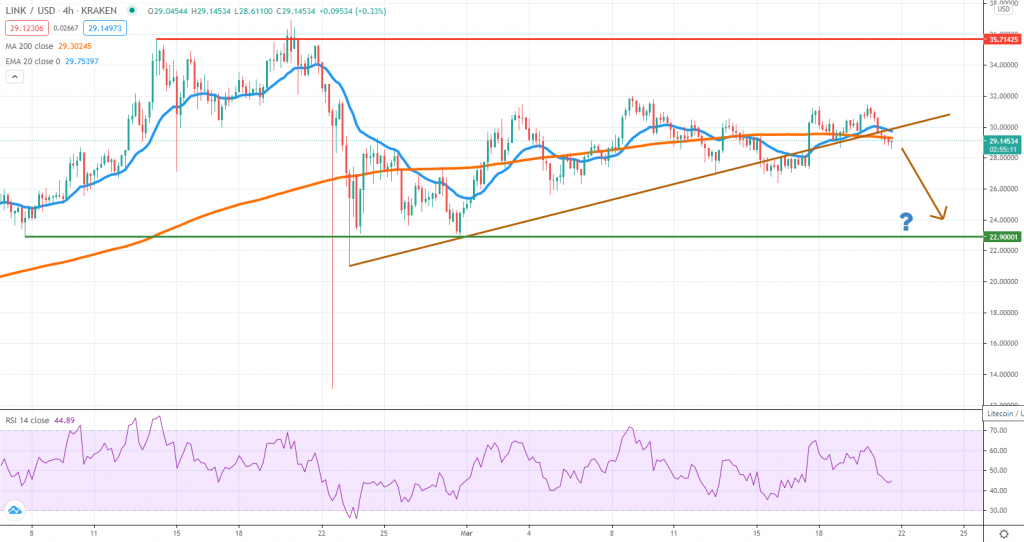
Although Chainlink managed to reach new all-time highs by the end of February, technical conditions had changed since then, as the token entered a longer corrective phase. More than that, we can easily notice a short-term ascending trendline that’s increasingly challenged by the sellers, which is raising the prospects for a new leg downward.
If we start to see the price trading below the trendline for a longer period, that will be a sign of weakness and the next downside target is located around $22. Breaking below would be a hit for LINK buyers since it could signal a continuation towards the low of the flash crash on February 23rd.
As long as the price keeps trading above the trend line and if it manages to break above $32, that will be an early indication for continued buying. In that case, the all-time high might be again under pressure. However, we think the bearish scenario is slightly more favored for the time being.


There are no comments at the moment, do you want to add one?
Write a comment