
BTCUSD (Coinbase)
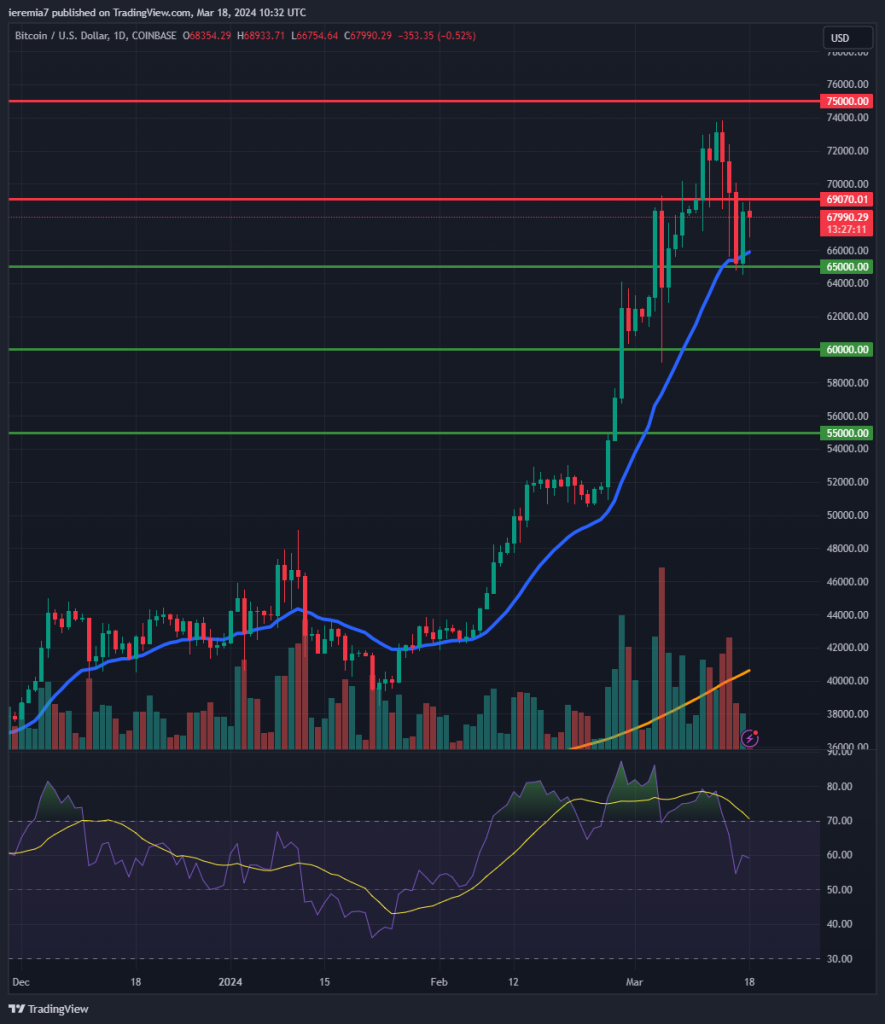
Source: TradingView
Even though bulls managed to push the price above the 2021 ATH, that wasn’t enough for a sustained move on the upside. Bitcoin almost touched $74,000 and then retraced sharply towards $65,000, showing that this market remains vulnerable to selling pressure.
We believe traders have been ahead of themselves, chasing the rally, afraid to miss out on more gains. Even though the bullish trend remains intact, we expect more choppiness moving forward. This week we have the FOMC and that could shake things up. It is possible the FED will shift to a more hawkish stance, since inflation seems to be bottoming and rising from 3%.
That’s not positive for risk assets and if the US Dollar and yields will rise, you should expect a deeper retracement in Bitcoin. The first strong support is $65,000, where the daily 20 EMA also overlaps. Further selling below will mean $60,000 is the next support to watch.
On the upside, the 2021 ATH at $69,000 remains a key role reversal level. Buyers need to push and hold the price above it to entice new traders to step in at these elevated levels. Above that, $75,000 is a psychological level and resistance.
ETHUSD (Kraken)
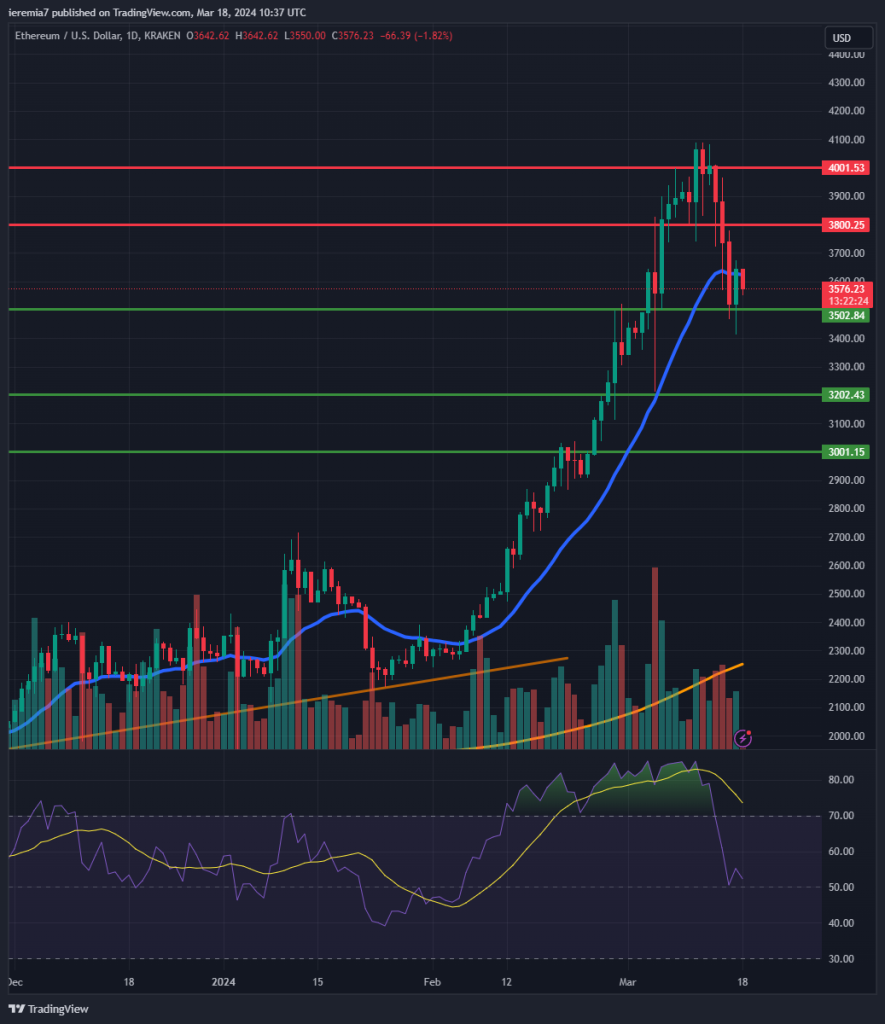
Source: TradingView
Ether displayed a similar performance, after touching the $4,000 key area. Buyers were unable to hold the price above that zone and what followed was a robust wave of profit-taking. As we can easily see from the chart, the correction move stalled around the daily 20 EMA + $3,500 area.
Since ETH is still trading above the area to start the week, it is still to watch and traders should monitor the market for further price action clues. Even though we are in a bull market, corrections are normal.
As a result, one should not rule out further selling, if technicals continue to deteriorate. The price could bounce around $3,200 or $3,000, two significant levels where buyers might be interested in rejoining the trend at more affordable prices.
In terms of notable resistance levels, we believe $3,800 and $,400 are areas of interest. This week could be choppier and have less directional bias attached to it.
SOLUSD (Binance)
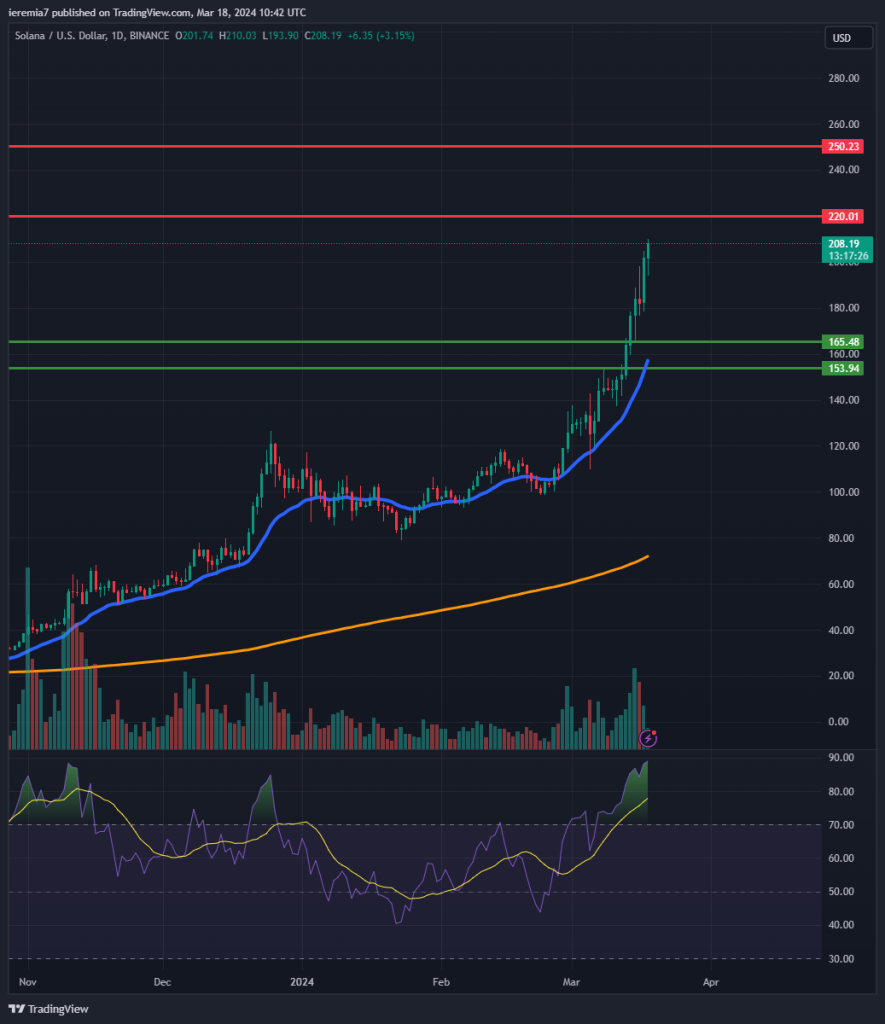
Source: TradingView
Despite weakness in BTC and ETH, traders seem to have shifted attention to some other altcoins. Solana was up 40% last week, which shows that the exuberance continues in specific areas of the market.
Looking at the chart, we see relentless buying and now it looks like the uptrend could extend towards $220, or $250. These are strong resistance levels where the market can pull back, if not reverse.
It’s hard to fight against such strong bullish moves, but that doesn’t mean you should chase the market at these higher levels. The best approach would be to wait for a pullback because, in that scenario, you can gain exposure at a more affordable level.
In case there will be signs of weakness, we will expect SOL to weaken towards the daily 20 EMA. As you can see from the chart, the market is overbought, with the daily RSI trading close to 90! That’s an extreme and unsustainable level, raising the prospects for a pullback.


There are no comments at the moment, do you want to add one?
Write a comment