
BTCUSD (Coinbase)
Source: TradingView
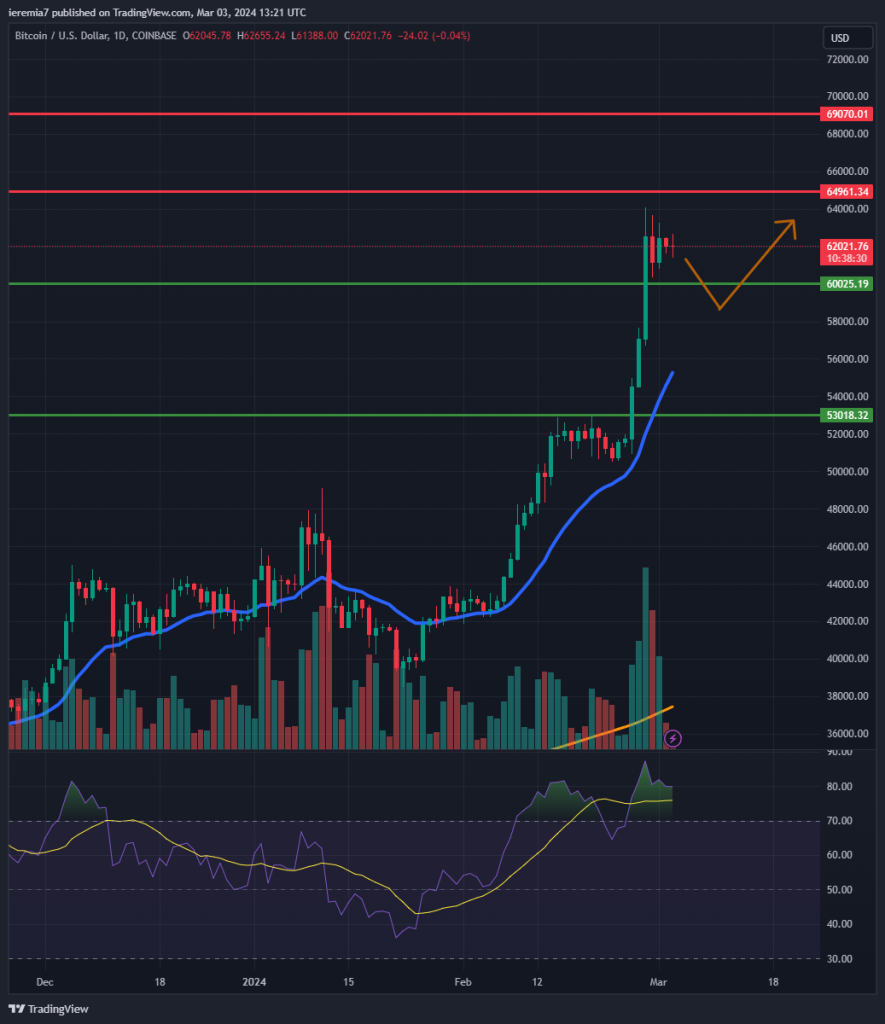
In our last weekly analysis, we expected continued consolidation and this assumption was wrong. Bitcoin broke above $53,000 and what followed was a major move on the upside. The price found temporary resistance near $64,000, but it’s clear now that the all-time is closer than ever this year.
Buyers were energized by a new major purchase from Microstrategy. Combined with heavy inflows into BTC ETFs, we have an imbalance between bulls and bears. The market is also speculating on the April halving, after which the daily supply of new Bitcoin will drop from 900 to 450.
To see the market continuing up at the same pace, tighter supply is not enough, demand should also be robust. Shifting to technicals, after such impulsive moves, traders should expect consolidation. We view $60,000 and the daily 20 EMA as short-term support levels.
On the upside, if bulls resume, we could see $65,000 or even $69,000, where the all-time is located, reached. We are approximately 10% below the ATH, so covering the ground shouldn’t be an issue for buyers.
ETHUSD (Kraken)
Source: TradingView
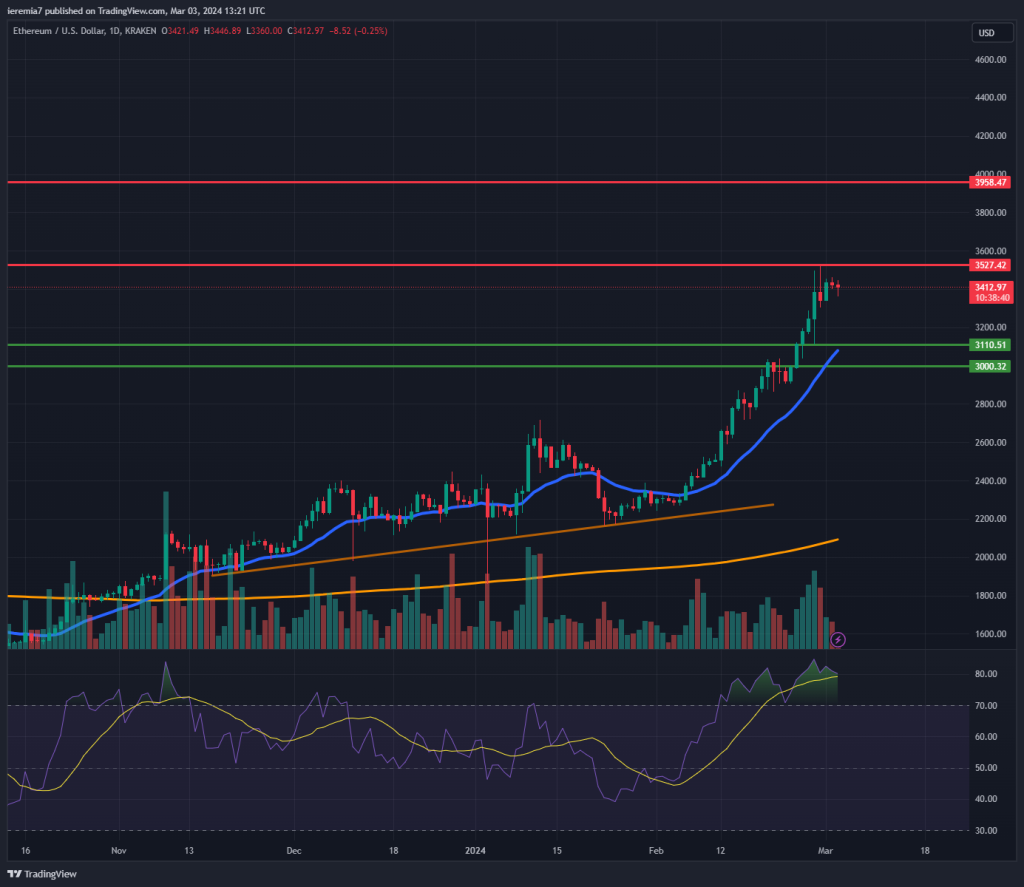
Since Bitcoin was strong on the upside, Ether followed suit. The price almost touched the $3527 resistance level we mentioned a week ago and as things stand, buyers might be able to drive the price above it.
Looking at the RSI on the daily chart, it is overbought but has been that way for multiple weeks in a row. The move up will break at some point, yet it’s tricky for short sellers to time the market. The price action will show us the way, but for now, the upside holds the upper hand.
If the price breaks and holds above $3,500 on a daily basis, expect further gains. The price action could get choppier since there are some swing highs on the weekly chart around that area. Ether managing to consolidate the gains will mean the next upside target shifts towards $3,950.
Our bearish scenario involves a pullback to the daily 20 EMA or the 3,100 level. In confluence with the $3,000 psychological area, that should act as a barrier in the face of strong selling pressure.
SOLUSD (Coinbase)
Source: TradingView
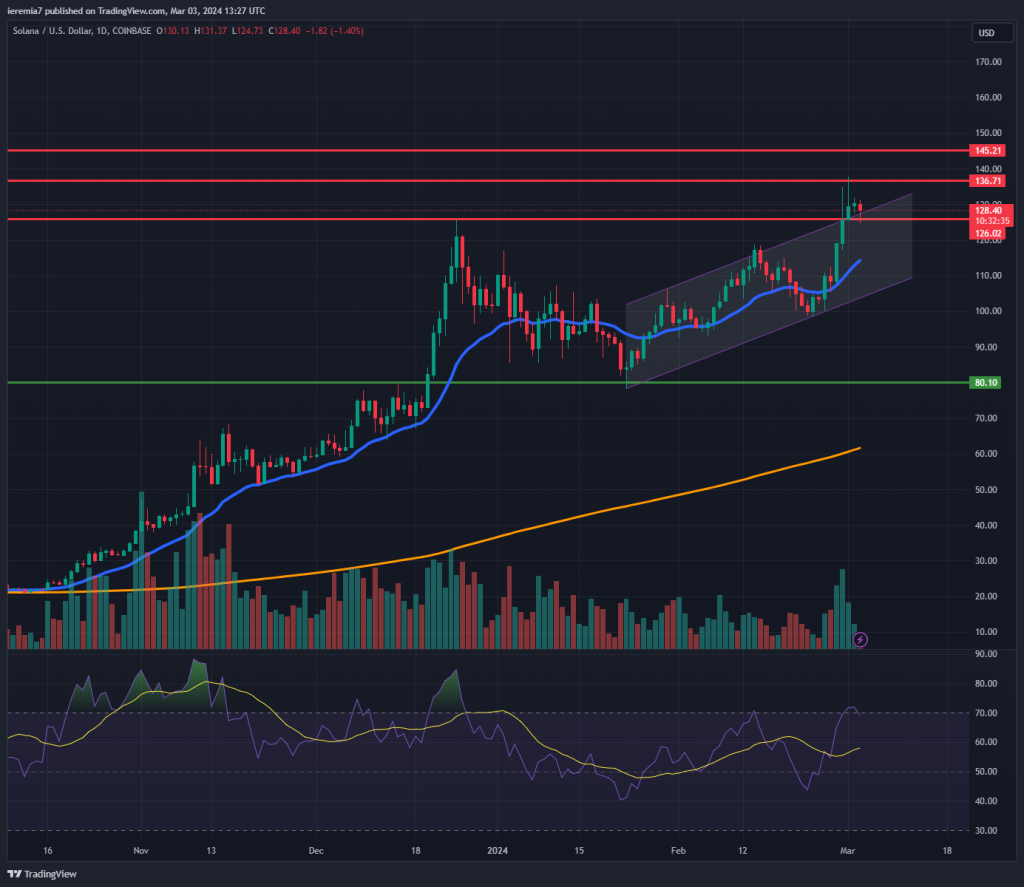
The broad risk sentiment favored Solana last week, given the coin is up 25%. Looking at the daily chart, the price reached and broke above the December 2023 high, which is a bullish sign. Additionally, we can notice the price has been trending up, inside a channel, during the last couple of weeks.
Since the momentum was strong enough to break above the channel, that indicates bullish interest is so high, that the price continues to move up. Although $126 remains a resistance level for now, we think there is scope for further buying until $136 and $145.
If Bitcoin starts to consolidate at the current levels, the market will shift attention to altcoins and Solana can benefit. However, you must consider the scenario in which the price weakens.
For that, we need to see SOL trading back inside the channel highlighted in our chart. If that is the case, there will be room for weakness towards the daily 20 EMA and $110.


There are no comments at the moment, do you want to add one?
Write a comment