
BTCUSD (Coinbase)
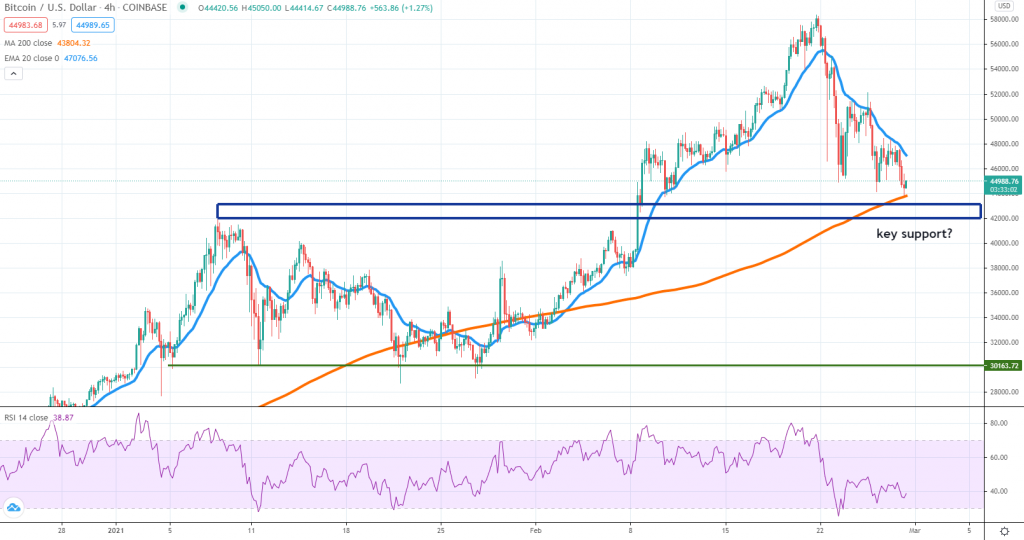
The inevitable had occurred and Bitcoin is now poised to end the week with sharp losses. The price tumbled from a record high to as low as $44,000, communicating there is little interest from the buy-side. However, as the week is wrapping up, the price is also approaching a key support area, formed around the 4h chart 200 SMA, as well as the $42,000 area, where a former all-time high is located.
Impulsive selling below that zone will be a major bearish development and could signal more pain down the road for Bitcoin. A 50% retracement would be on the table and the $30,000 will follow as a strong support zone.
However, we don’t believe the price will drop in a straight line and buyers could attempt to drive BTC higher once again as a new month begins. Traders need to watch how the price performs around the 20 EMA since it had been treated as a resistance this week. A break above it will open more room towards $50,000 or even higher.
ETHUSD (Kraken)
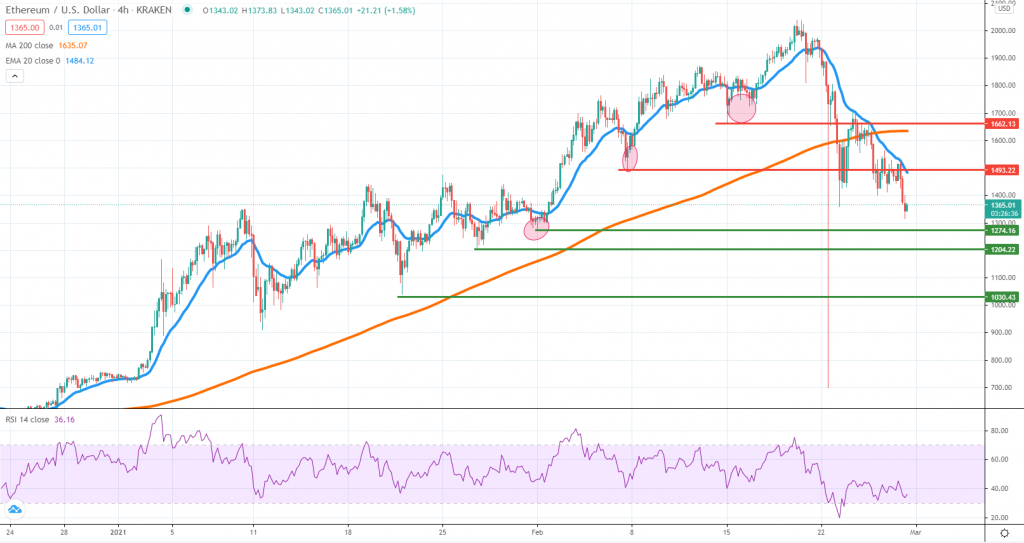
The selloff had been more severe for Ether, which flash-crashed on the Kraken exchange. Dropping from $1,900 all the way to $700 was a major hit for the sentiment and ever since the price continued to weaken, although still above the weekly lows. We can easily notice that the areas we’ve highlighted a week ago on the chart had been broken and then treated as resistance.
As long as the price action structure does not change for the better, we suspect there is more downside ahead for ETH. Traders need to watch how the price will react around the $1,200 area, and if that won’t be a strong enough support, $1,000, a key psychological zone will follow.
After months of outperformance, the second-largest token is back under pressure and there are serious reasons to believe the February 20th high might be a meaningful top. Same as with Bitcoin, we believe buyers will attempt a rebound but only a break to new ATHs will negate the selling bias.
TRXUSD (Bitfinex)
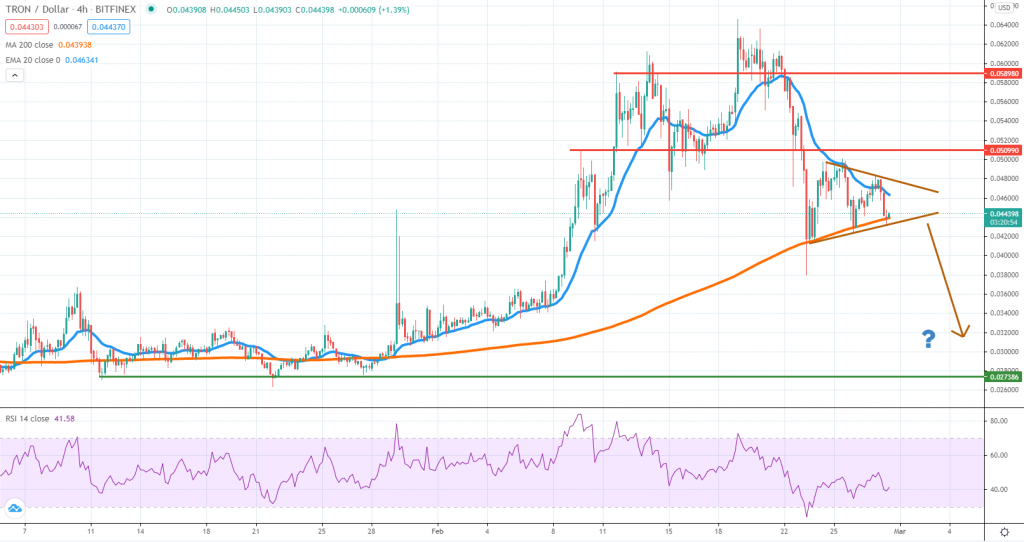
Considering the selling had been engulfing the broader market, Tron had been spared. The price dropped more than 40% from the highs during the past week, yet managed to find short-term support around the 4h chart 200 SMA.
On top of that, the price continues to consolidate inside a small triangle formation, a consolidation following a very impulsive move. The higher probability is for a continuation lower, if the triangle will be breached to the downside. In that case, we suspect TRX could edge lower towards 2.7 cents over the next few weeks.
If buyers gain momentum and rotate on the upside, expect resistance to be encountered around 5 cents or 5.8 cents. Volatility is elevated and it shouldn’t be a surprise if the price spikes higher only to resume impulsively on the downside.


There are no comments at the moment, do you want to add one?
Write a comment