
BTCUSD (Coinbase)
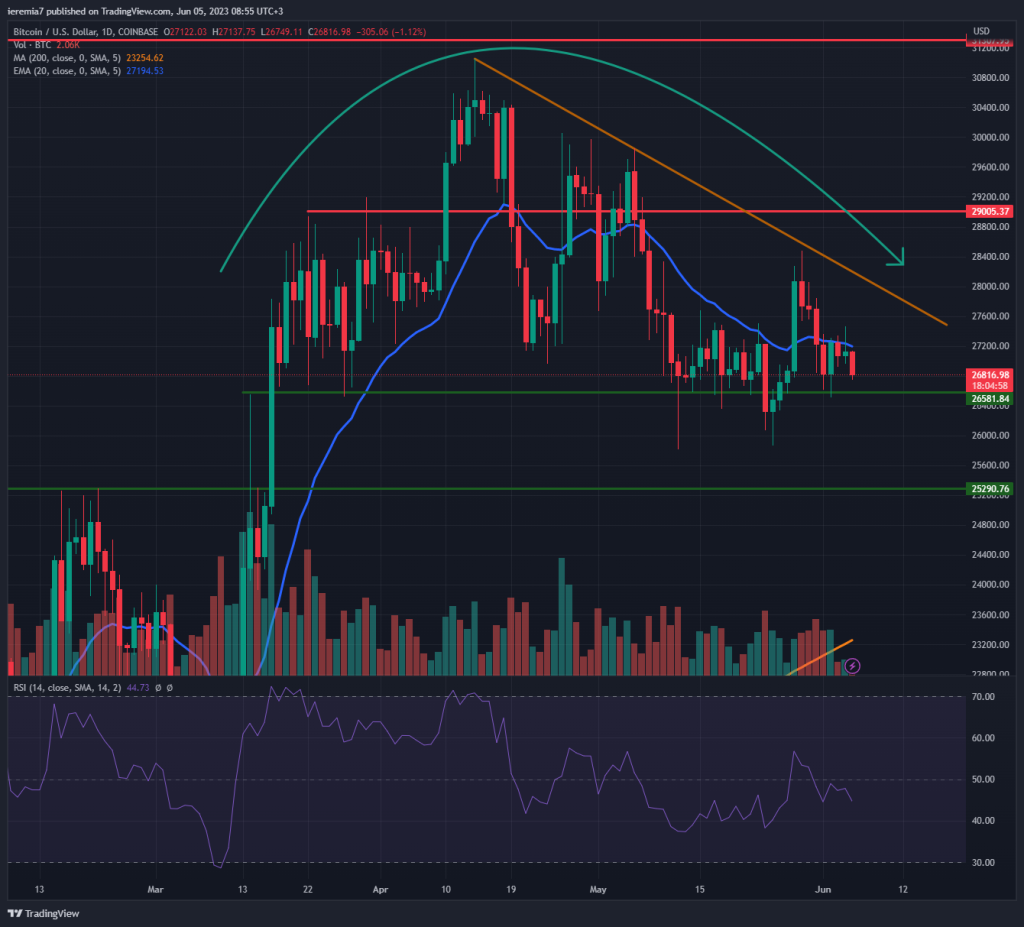
Despite strong risk appetite across all stock markets last week, Bitcoin failed to deliver. In fact, we see the price ended in the red for the week and now trades below the 20 EMA. Moreover, the falling trend line continues to be in play, as buyers didn’t even manage to touch it before the selling resumed.
With that being the case, we maintain a cautiously bearish stance for this week, considering the technicals are not yet in favor of a strong bounce higher. If BTC stays below the 20 EMA, we expect short-term support around $26,500. It becomes increasingly likely that the move lower will extend toward $25,000.
That’s a stronger demand zone and larger buyers could enter around it. On the upside, the trend line acts as a ceiling for the time being. Breaking and closing above it on a daily basis would be a sign the sentiment hand improved. We favor an extension towards at least $29,000 if that happens.
ETHUSD (Kraken)
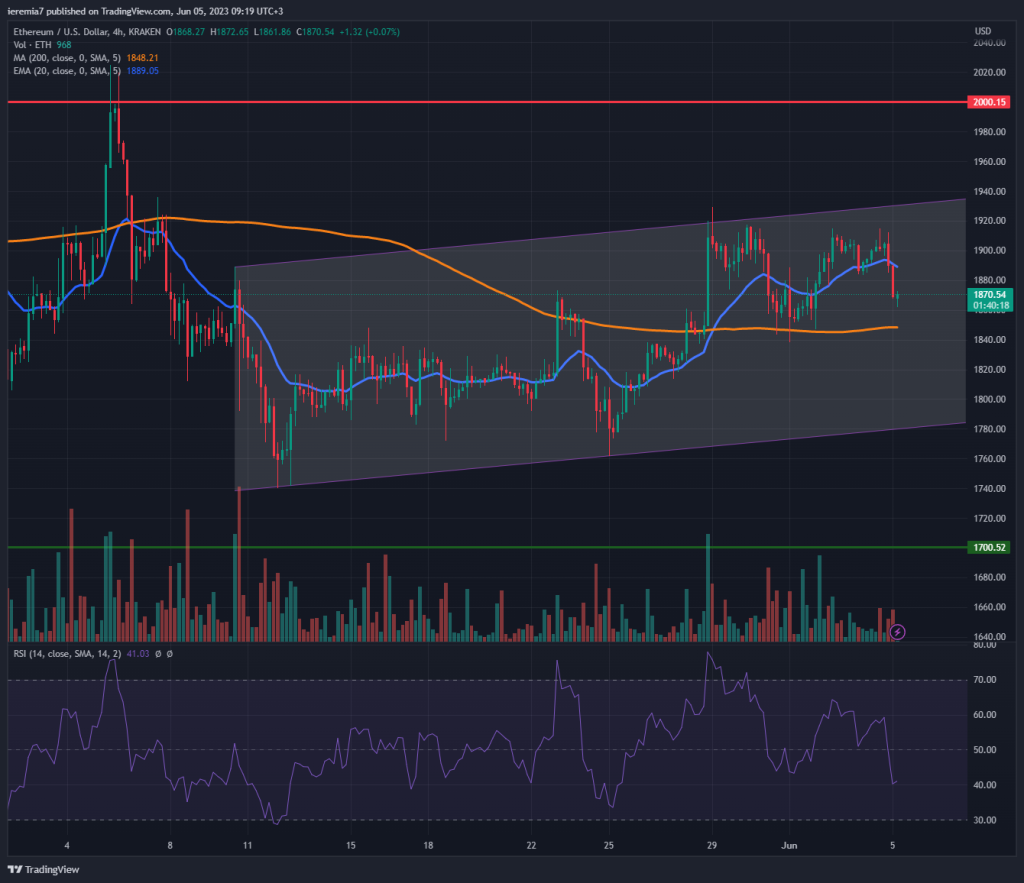
From a price action perspective, Ether has been outperforming BTC last week and although the market traded sideways, traders who bought short-term dips could bank some gains. On the 4h chart, the price managed to break above and then retest the 200 SMA, which is a bullish development.
However, broad market weakness seems to weigh on the upside, so we see short-term spikes followed by selling pressure. It’s hard to predict what’s going to happen next in this environment, so the only thing left is to focus on major key areas.
The upside target is $2,000, only if the price manages to break above the ascending channel we’ve plotted on our chart above. Momentum is likely to gain more steam once above that area, but at this stage, even a test of $2k would be more than welcome.
Weaker sentiment will be confirmed by a break back below the 200 SMA. In that scenario, the lower bound of the channel and then $1,700 are expected to act as support areas.
XRPUSD (Bitstamp)
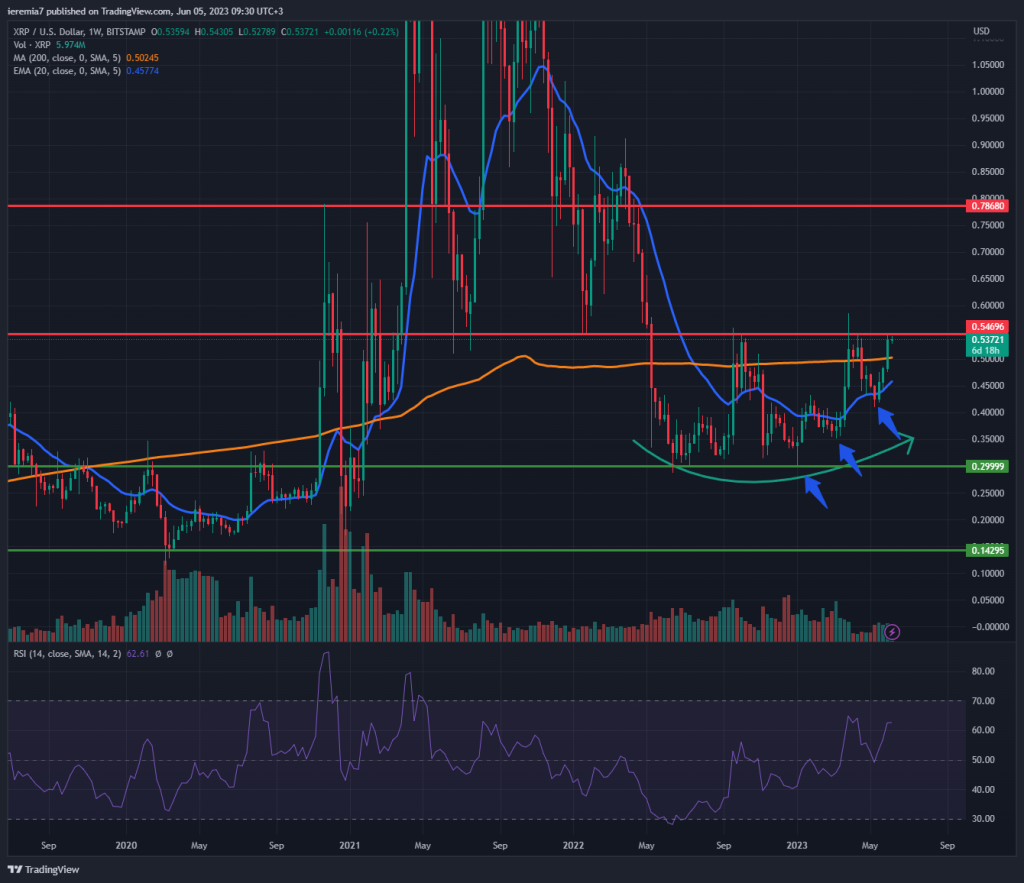
XRP is the major outperform among the top 10 cryptocurrencies. It’s up more than 11% during the past week and even the price action structure looks a lot better. We can see how the market is pressuring XRP above the daily 200 SMA. Moreover, there are several higher lows highlighted on the chart and now the price treats the 20 EMA as support.
This could be a potential parabolic structure if we break above 55 cents and that will unlock more upside gains. We view 78 cents as a major resistance, in case the scenario turns out to be true. One should not ignore the potential for market weakness, hence the bearish scenario.
An early sign of weakness would be a break below 40 cents. The parabolic structure would be called into question and then there will be scope for a retest of 30 cents. Below that, 15 cents is another interesting level, but sentiment should take a massive hit in order to get there.


There are no comments at the moment, do you want to add one?
Write a comment