
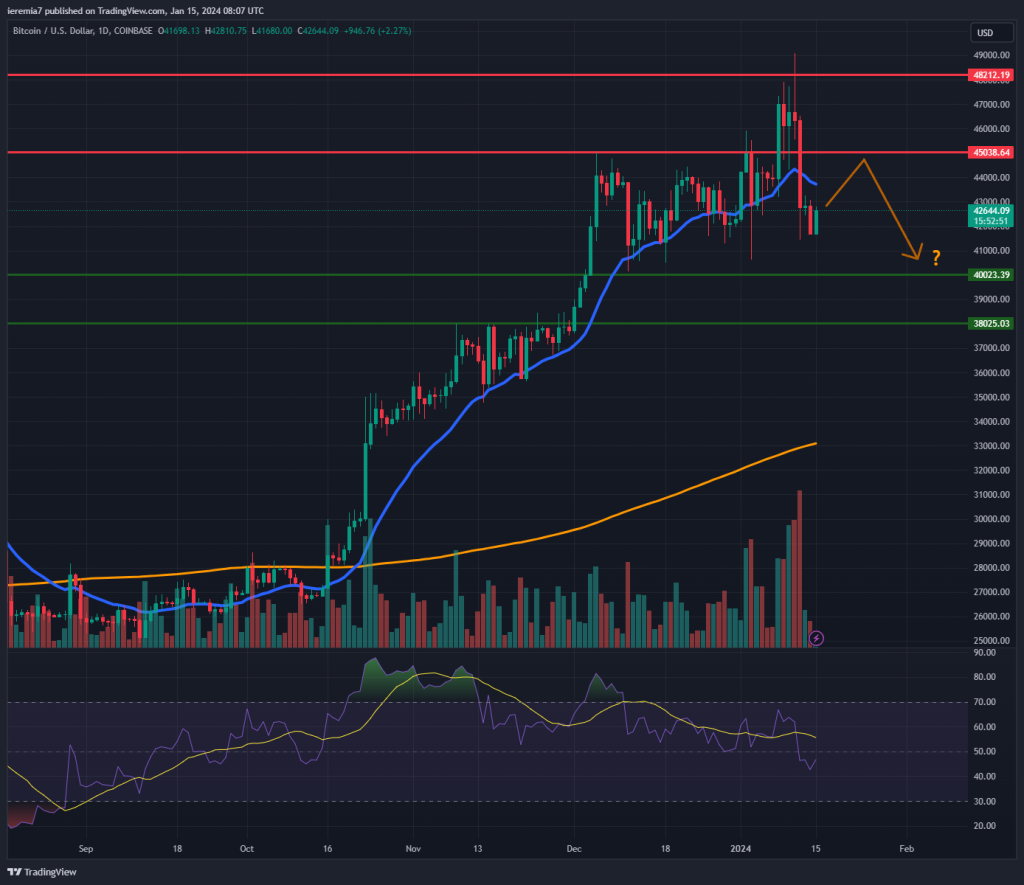
BTCUSD (Coinbase)
Source: TradingView
The ETF drama is over and now there are 11 such instruments listed in the US. We’ve warned that a buy-the-rumor sell-the-fact scenario could unfold and so far our call has been right. Additionally, we’ve flagged the $48,200 as a key resistance level and the price failed to close above it on the daily chart.
You can see how the price sold off substantially after briefly touching $49,000. Bitcoin ETF trading volumes are below expectations, which is why there could be more pain ahead. The selloff drove the price below the daily 20 EMA and now we believe there is scope for a pullback higher, before a new impulsive leg lower. Traders need to watch the EMA and then the $45,000 area.
On the downside, the key support levels to consider are $40,000 and $38,000. Be aware that the positive seasonal window for Bitcoin is closing and pressure could mount on the coin. We do not suggest the bull trend has ended, however. For that to happen, BTC has to break impulsively below the $33,000 area, where the daily 200 SMA is currently located.
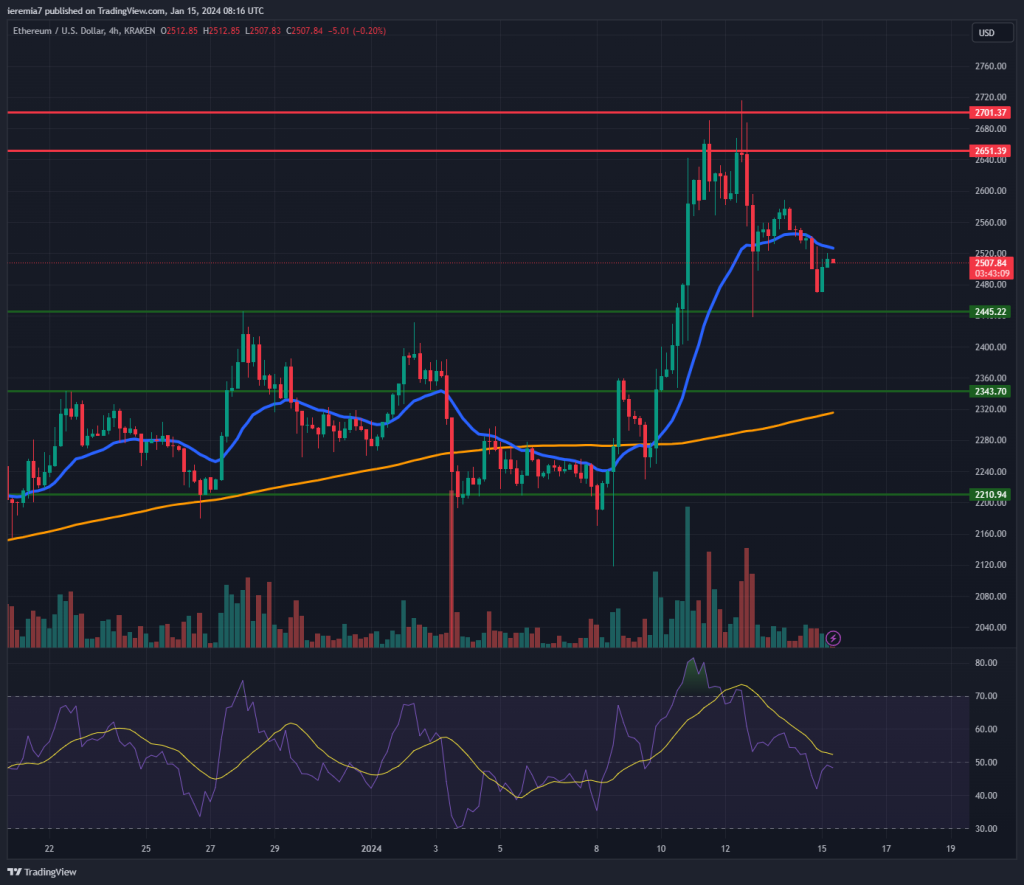
ETHUSD (Kraken)
Source: TradingView
Now that the chase for a Bitcoin ETF is done, the market is shifting attention to the next coin that could be in this position. Of course, Ethereum is a solid contender and as we move forward, we expect ETH to outperform BTC on the upside and downside.
Technically, that’s already the case even though the price sold off in tandem with Bitcoin. Despite the dip, you can see that the market didn’t breach below key support. In fact, the $2,445 key role reversal level has been treated as a buying zone. Sellers need to clear that area and only then should we expect more losses towards $2,340.
The upside was capped by $2,650 and $2,700. You can see the price action is clear as water on the 4h chart, as candles show how sellers regained control around those levels. We need to see a break and hold above them in order to have our confirmation that the trend will extend higher.
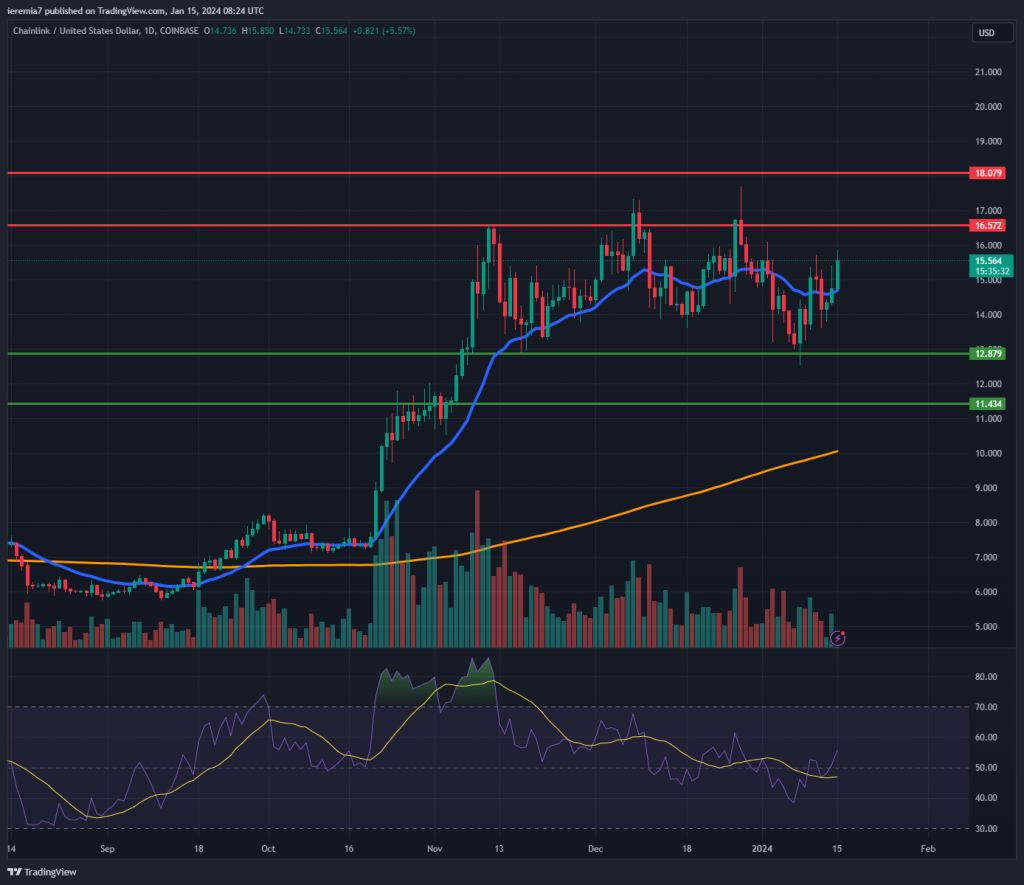
LINKUSD (Coinbase)
Source: TradingView
Chainlink has been consolidating in a range since November 2023 and already set up a base around $12.8. Around a week ago, the market treated that level as support and since then the price is up approximately 15%.
We believe that at this stage LINK is trading inside a range between $12.8 and $16.6. Traders need to carefully watch how the price reacts to the upper side of the consolidation. A break and hold above it will open more room towards $18.2 and then $20.
Based on the broader picture, the upside is clearly favored and we expect Chainlink to continue edging up during the upcoming weeks and months. However, one shouldn’t neglect the potential for weakness.
The first such sign will occur if the price fails to break above $16.5. In that case, we could see LINK weakening towards the daily 20 EMA. Another notable support below is $11.4, but sellers need to pull off more strength if they want to drive the market there.


There are no comments at the moment, do you want to add one?
Write a comment