
BTCUSD (Coinbase)
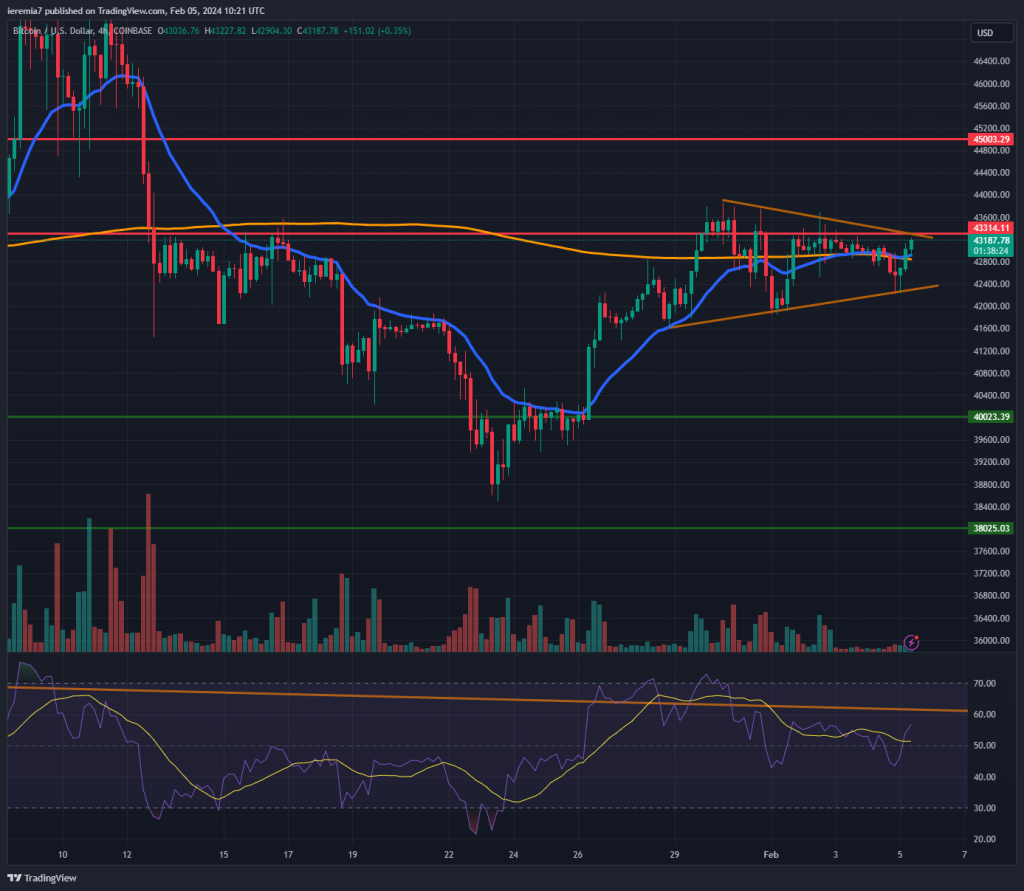
Source: TradingView
We can’t see a lot of activity in Bitcoin during the last couple of days and it looks like buyers have shifted attention to other coins. In terms of technicals, the price is now locked inside a triangle pattern and figuring out the next impulsive move looks a bit tricky.
However, given we are in a bull market, buyers have a slight edge. The $43,300 level, which we highlighted last week, capped the upside, so if the market breaks and holds above it, $45,000 will become the next area of interest.
Above that, Bitcoin has a clearer path towards $50,000. The April halving is approaching and based on historical data, BTC volatility can spike, both on the upside and downside. Buying for the longer run at this stage is not optimal from a risk management perspective.
That’s why it will be healthier for the market if we see a correction towards the $35,000 area. In the meantime, $40,0000 and $38,000 are other strong support levels that need to be breached. Following the $38,500, buyers seem to be squeezing shorts, which can lead to further gains in the upcoming days.
ETHUSD (Kraken)
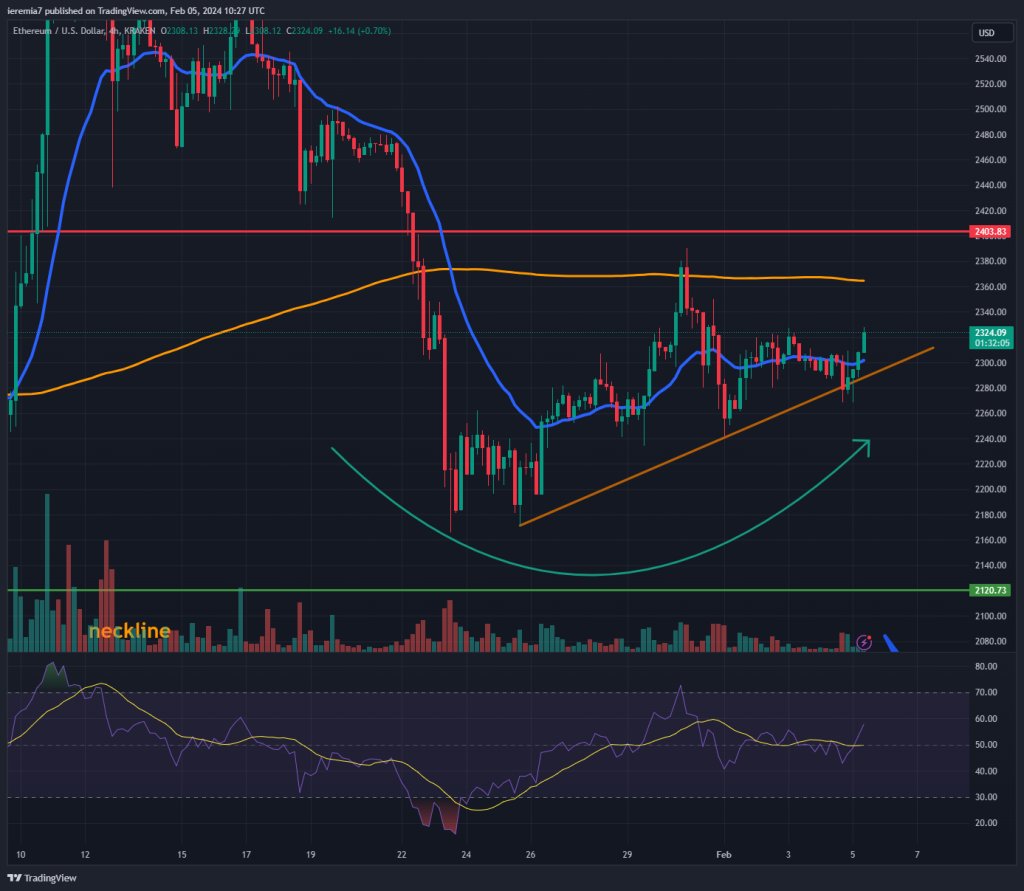
Source: TradingView
Despite strong gains in tech stocks last week, the crypto market failed to follow the same path. Ether is another example of underperformance, as the price traded water for a couple of days. Some early signs of improvements in the price action are emerging, since the market is now treating the 4h chart 20 EMA as support.
A series of higher lows are also encouraging and the next step will be a higher high. For that to happen, ETH must break above the January 30th high. In the meantime, the 200 SMA is a resistance level. Above that, traders should watch the price reaction around $2,400.
Given a short-term ascending trend line has already been confirmed, we believe buyers have a slight edge. A deteriorating sentiment will become obvious if the price breaks below $2,250. There’s scope for further weakness towards $2,120 in that case.
LINKUSD (Coinbase)
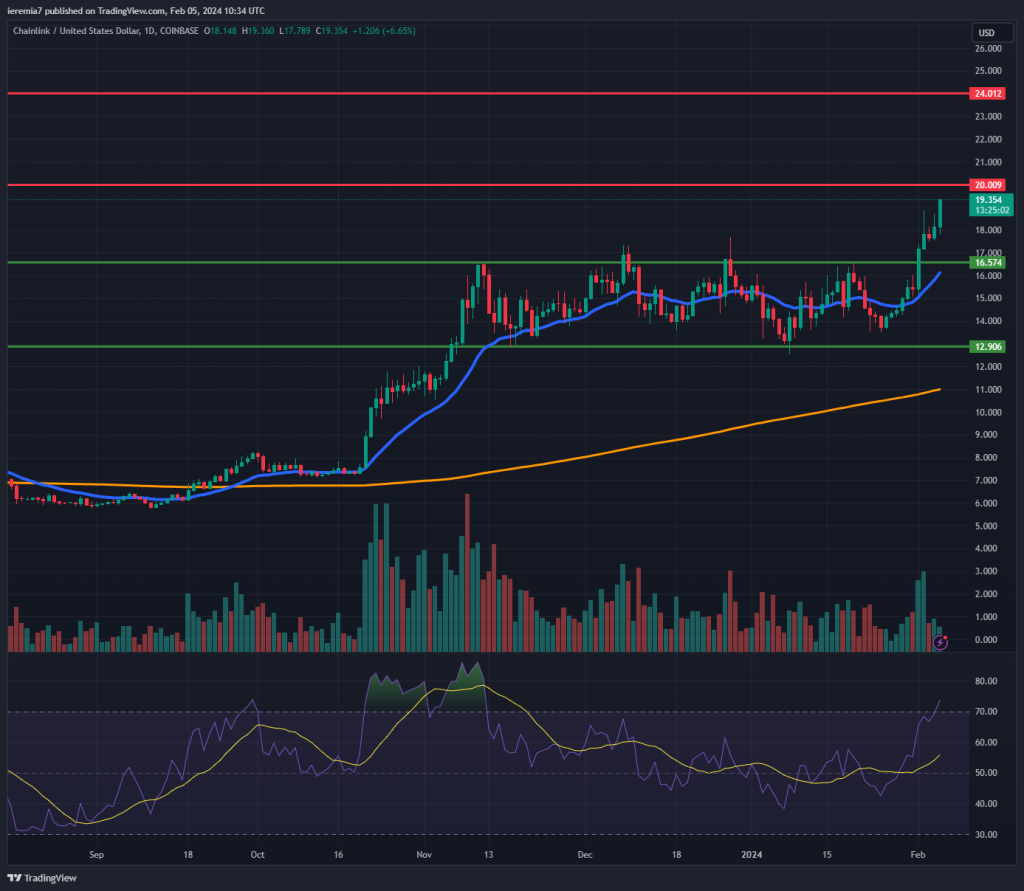
Source: TradingView
Chainlink is posting a 7-day gain of +30% and when looking at the daily chart, the order flow is heavily in favor of further upside. As you can easily see, the price was locked in a range between $16.5 and $12.9. Once the buyers broke above, follow-through bids continued to push the market up.
Shorting LINK at this stage is not the best strategy, given buyers will look to buy the dips. We view consolidations towards $18 and $17 as buying opportunities until the market breaks impulsively below the daily 20 EMA.
As for the upside targets, it looks like Chainlink will soon reach $20 and traders should monitor the price action structure there. There’s scope for further gains and we think this trend could extend towards $24.
The bearish scenario will kick in only if the price breaks below $16.5. As we’ve said earlier, that’s the upper side of a range that has been in play for over 2 months. Anyways, we are well above the daily 200 SMA and that suggests a bullish market.


There are no comments at the moment, do you want to add one?
Write a comment