
BTCUSD (Coinbase)
Source: TradingView
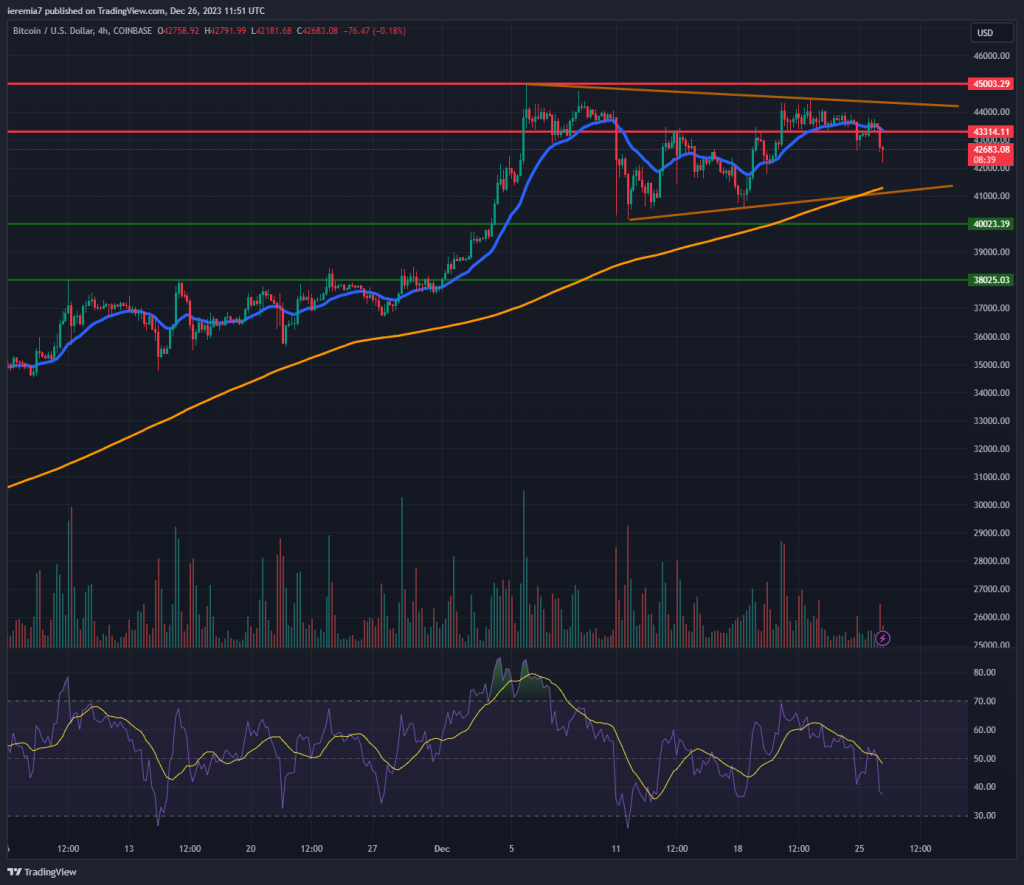
Happy holidays to all our readers! It’s the last week of 2023 and as expected, Bitcoin volatility is compressing. The coin staged an impressive rally this year, so there’s no point for market participants to make a strong push now.
As our chart shows, the price action fluctuates inside a triangle structure. We would need to see a breakout and continuation on either side to have a confirmation that this market could move a lot during the week. Most of the key areas remain in place for the upcoming days.
To the downside, we need to note the lower line of the triangle, doubled by the 4h chart 200 SMA. Not far from that area is the $40,000 where buyers should also resume impulsively.
The upside seems to fade around $43,300 and then the upper line of the triangle. Thus far the rally stalled at $45,000, so you should mark that level as important. Those wanting to trade during the holidays can watch for mean reversion off the mentioned levels.
ETHUSD (Kraken)
Source: TradingView
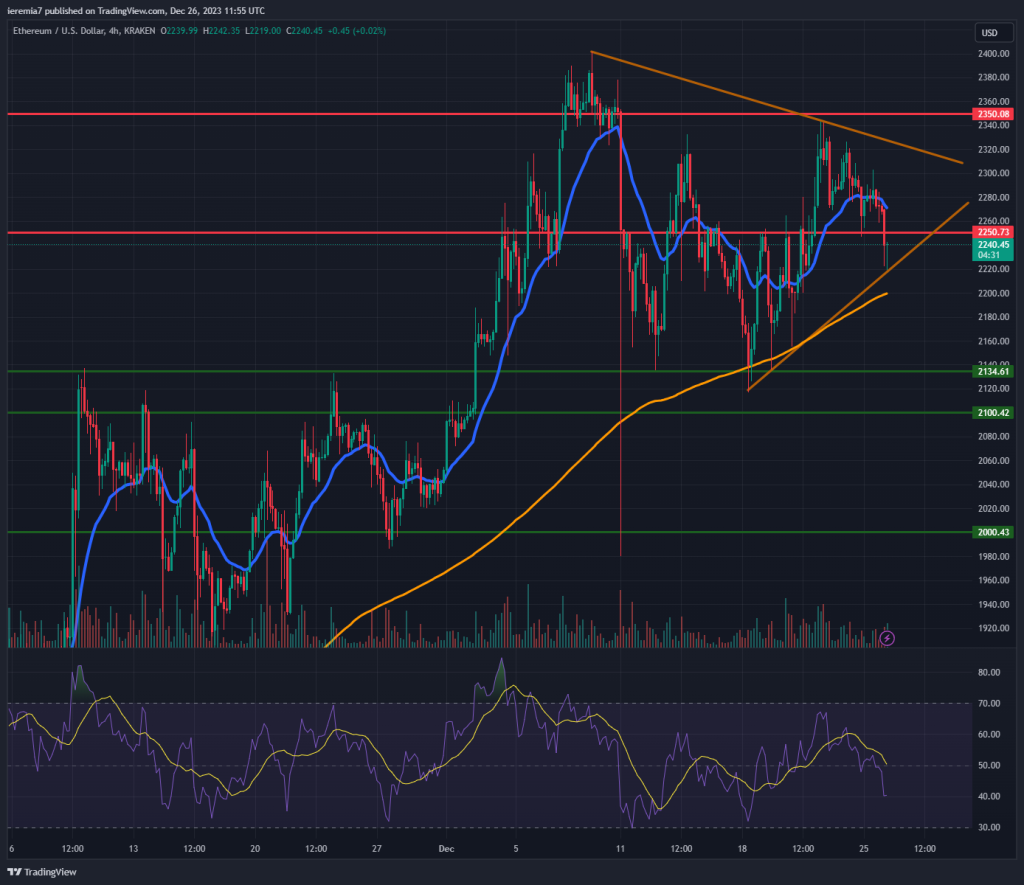
Although volatility looks a bit more elevated with Ether, a similar triangle structure seems to be unfolding on the 4h chart. When the market respects these formations multiple times, traders should pay attention to the price each time either side is touched.
As a result, if ETH breaks above $2,250, we favor a continuation towards $2,320 – $2,350. Bullish momentum should fade there, given a lack of directional bias induced by holiday trading. Some investors and traders might want to take some profits off the table, which can generally put pressure on valuation.
Despite that, we keep a balanced approach on Ether, as long as the price trades above the 4h chart 200 SMA, or $2,200 at the time of writing. Even below that level, we need to see strong selling and a dip below $2,000 to suggest selling is meaningful.
LTCUSD (Coinbase)
Source: TradingView
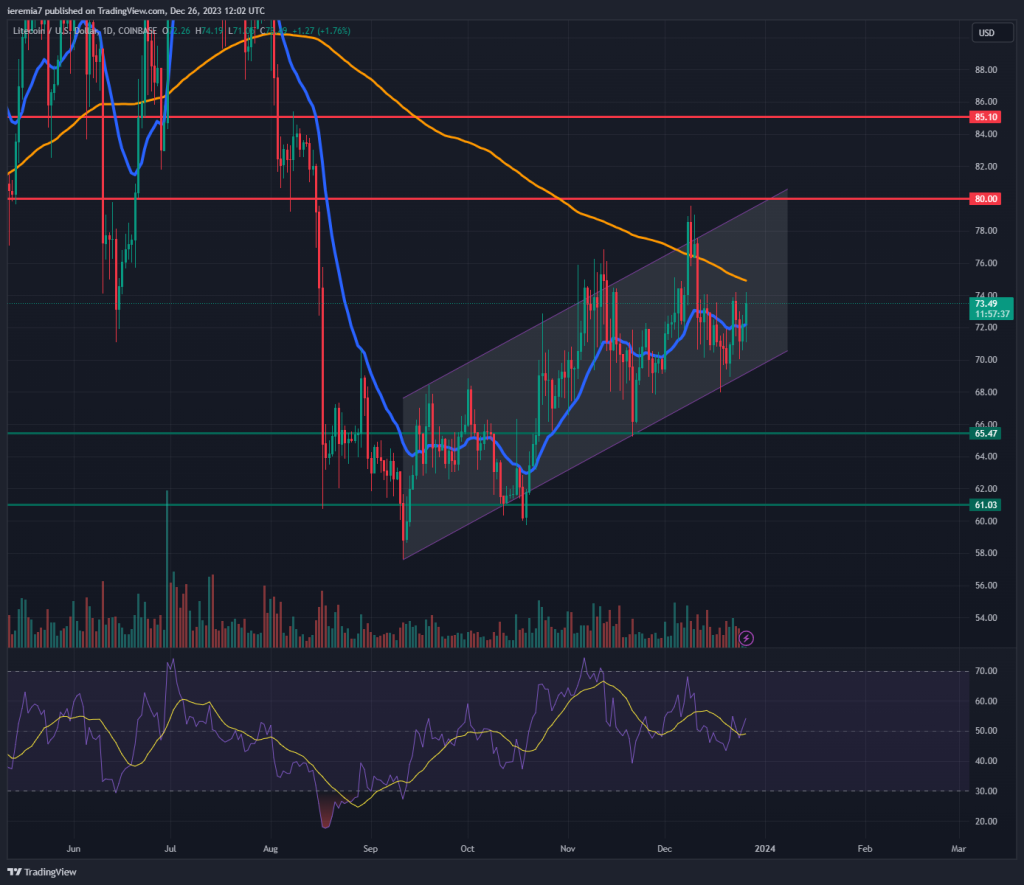
Litecoin has been trading inside an ascending channel since the first half of September 2023. The price managed to rise around 30% from the lows and there was no surge in volatility. We can see how each push higher was met with sharp pullbacks, suggesting heavy selling.
That did not lead to a break of the channel and since the structure still remains intact, we favor the upside during the upcoming weeks. Crypto seasonality will turn negative around mid-January, so bulls might have a last chance to push the price up.
As you can easily notice from the daily chart, resistance emerged close to the $80 area, but traders should be mindful of the 200 SMA as well. So far the market failed to break and close meaningfully above it. Only after that happens, we could say Litecoin is in a structural bull trend. If buyers drive the price up, you should watch for resistance near $80 and $85.
In case the bullish channel breaks, then that would be bad news for bulls and LTC could dip towards $65 or $61. We view those levels as strong support since the price reacted to them nicely in the past.


There are no comments at the moment, do you want to add one?
Write a comment