
BTCUSD (Coinbase)
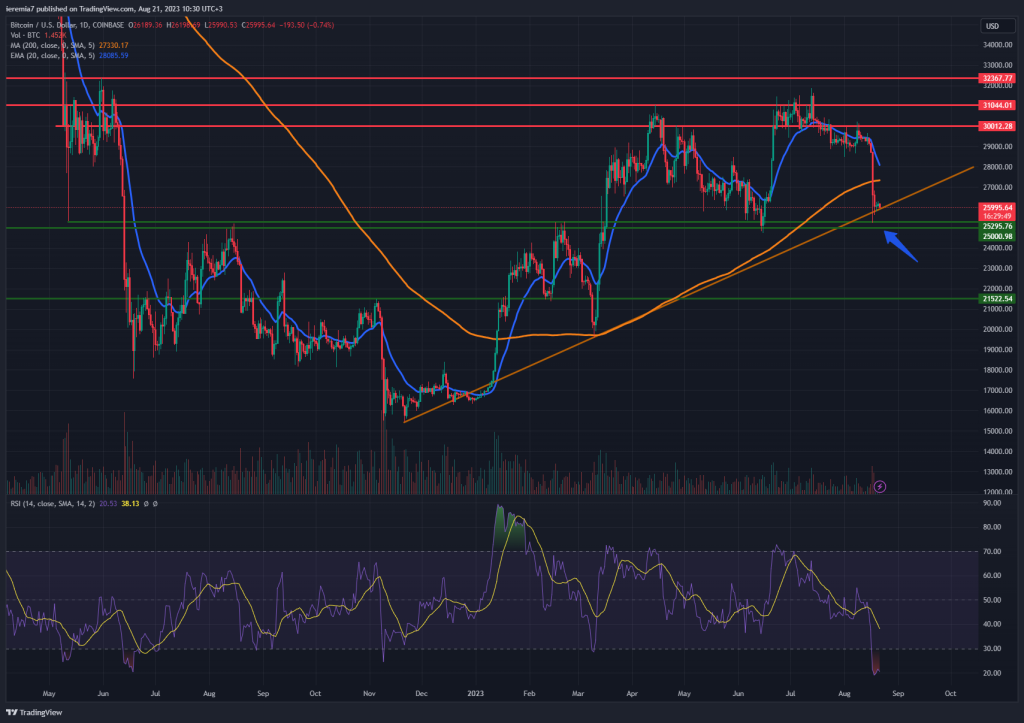
Source: TradingView
Last week was one to forget for Bitcoin bulls given the price slumped impulsively. We can see from the daily chart the magnitude of the move, as BTC broke below the 200 SMa and managed to find support around an ascending trend line.
Buyers managed to cap the downside, yet thus far there is no impulsive interest to prop up valuations. If the price continues to move below the trend line, that would be a negative sign. We view $25,000 as a strong support area and if that won’t be the case, there’s more downside left to explore in the weeks and months ahead. The next level of support is $21,500 that that would mean close to 50% of this year’s gains will be whipped out.
On the flip side, we can see that the ascending trend line held nicely since November last year. Additionally, RSI on the daily chart is very oversold, which creates proper conditions for a short-term bounce at least. Buyers interested in longer-term plays should wait for more confirmation. We want to see the price breaking and holding above the 200 SMA again.
ETHUSD (Kraken)
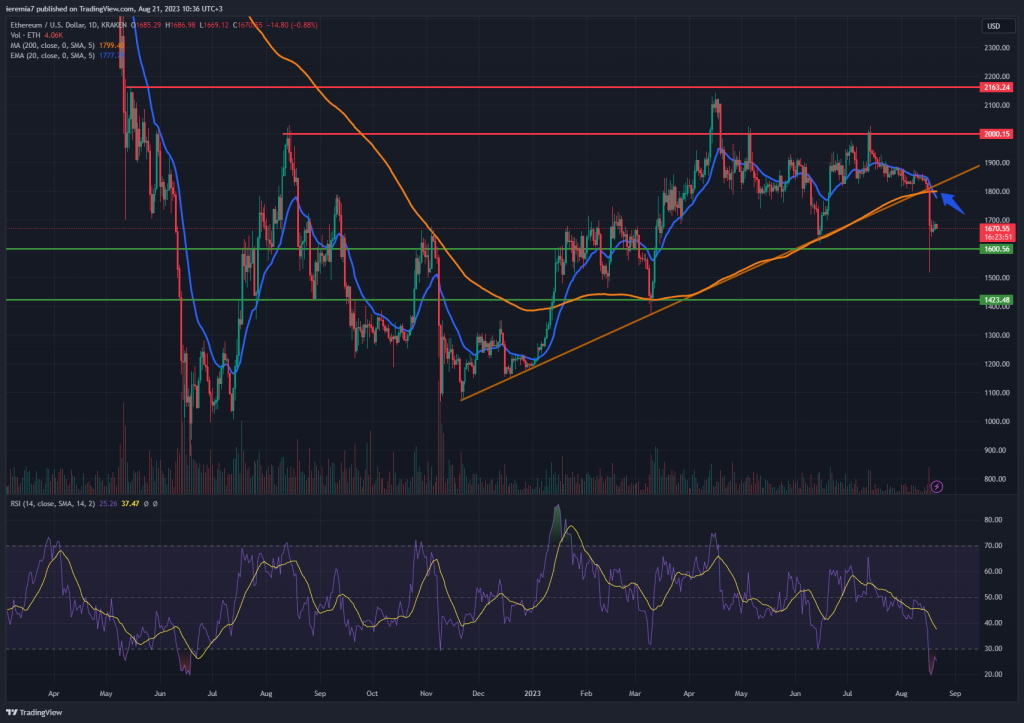
Source: TradingView
The technical picture in Ether is worse, considering the price has already breached well below the trend line that goes back to last year. This is a bearish technical development since the price has also broken below the daily 200 SMA.
We view limited upside potential as long as ETH is trading below the trend line. Moreover, each short-term bounce is likely to be followed by renewed selling pressure. This week could be choppy, which is why traders should carefully watch key levels. The price failed to close below $1,600 so that’s the first line to consider.
If Ether breaks $1,500, then more support is expected around $1,420. The first bullish step would be if selling stops this week. Then buyers will have a stronger footing to consolidate gains later on. In case a strong corrective move-up unfolds, the most important challenge will be to break back above the trend line and 200 SMA. We expect sellers to resume around that area.
LTCUSD (Coinbase)
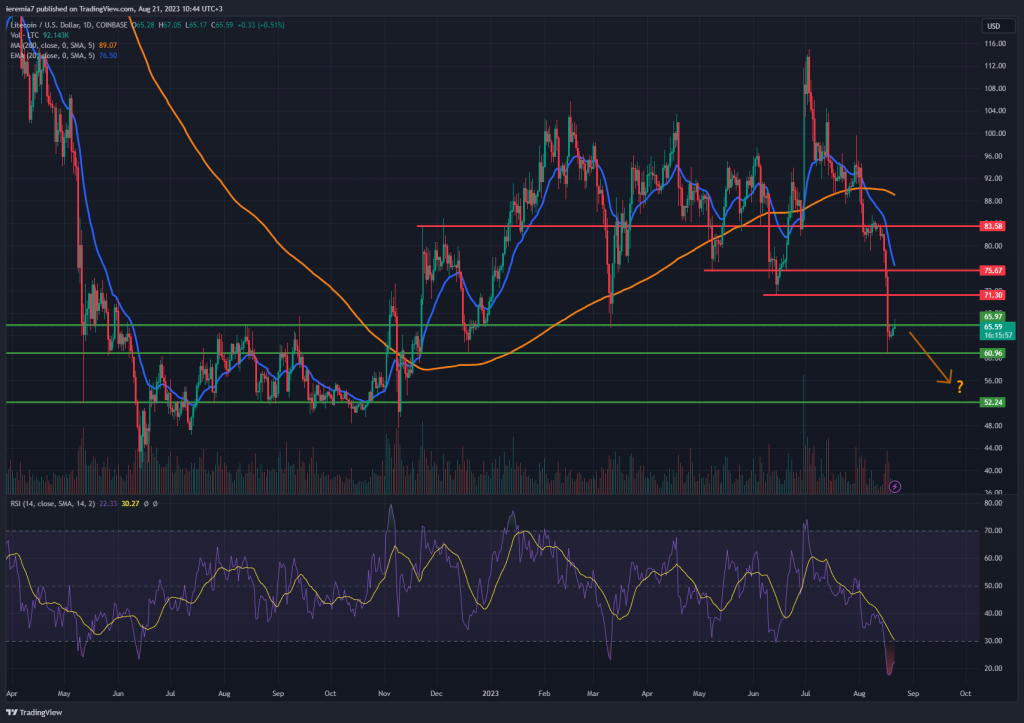
Source: TradingView
Some altcoins are posting heavier losses and LTC is a good example. The coin is down 20% last week and the picture is no longer favorable for buyers. Breaking below $71 and $65 creates a favorable environment to sell bullish pullbacks.
We can see how $60 acted as support, so if selling resumes, that’s the first level to watch. However, although there is room for a corrective move higher, we think the prospects for a major bull run have diminished at this stage. Long-term buyers might want to wait for a deeper move toward the $52 – $50 support area.
Moving forward, the market should treat $71 as a level of resistance. That’s a prior swing low where selling orders will await. Above it, $75 is another area to watch in the near term. Be aware that playing a bounce this week is a high-risk trade.


There are no comments at the moment, do you want to add one?
Write a comment