BTCUSD (Coinbase)
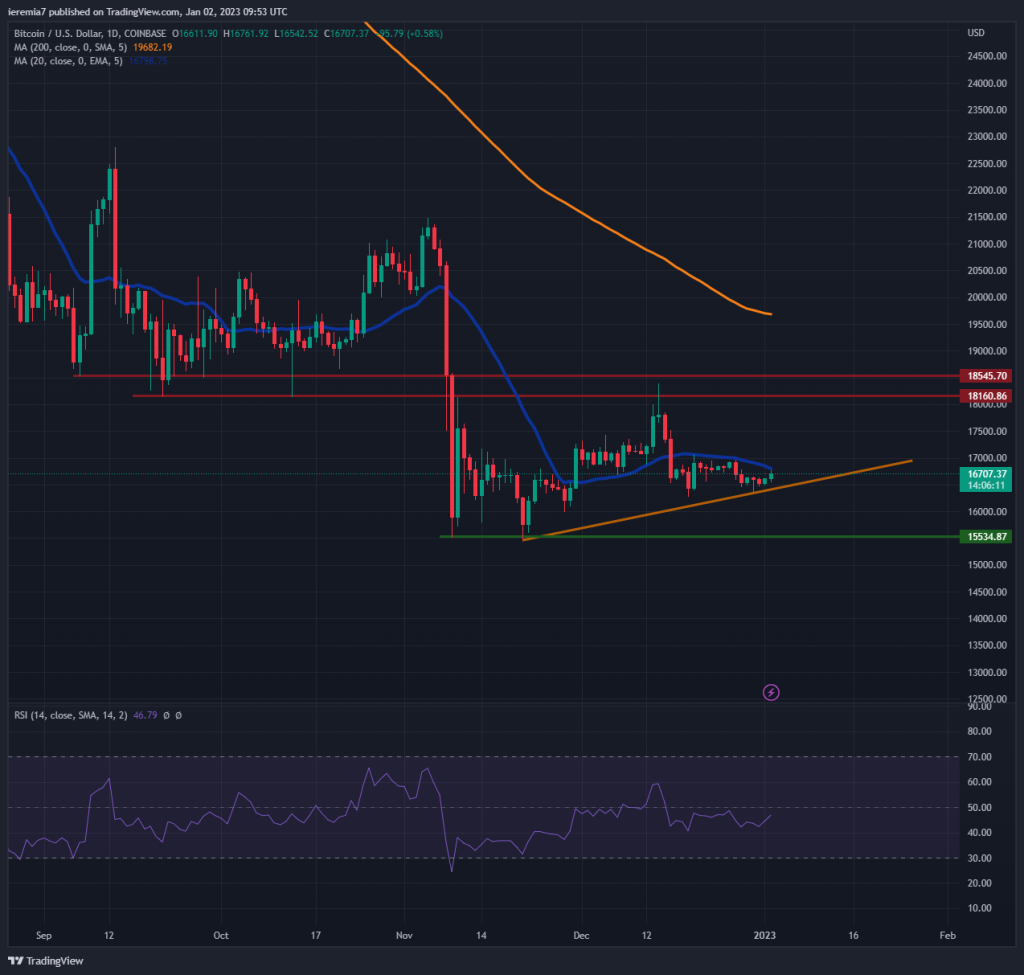
We’re back with the first weekly analysis for 2023 and Bitcoin seems to start the year on an upbeat tone. Technically, there is a short-term bullish trend line in play, so as long as we don’t see an impulsive breakout below it, there’s scope for some more gains, until market participants resume from the extended holiday.
Looking at the daily chart, the price is still trading below the 20 EMA and that’s a sign to remain cautious. The RSI is also trading around 50, meaning the market could go either way from this point. In case you start to see gains accumulating above the $17,000 short-term resistance, the focus should then turn to $18,100 – $18,500 which is a more significant area.
Breaking below the trend line would be a sign of weakness and in that scenario, we suspect Bitcoin could retest the $15,500 floor, which has been respected since the beginning of November 2022. A break and hold below it is bad news for bulls, suggesting the bear market might expect towards $12,000 or even the $10,000 psychological area in the mid-term horizon.
ETHUSD (Kraken)
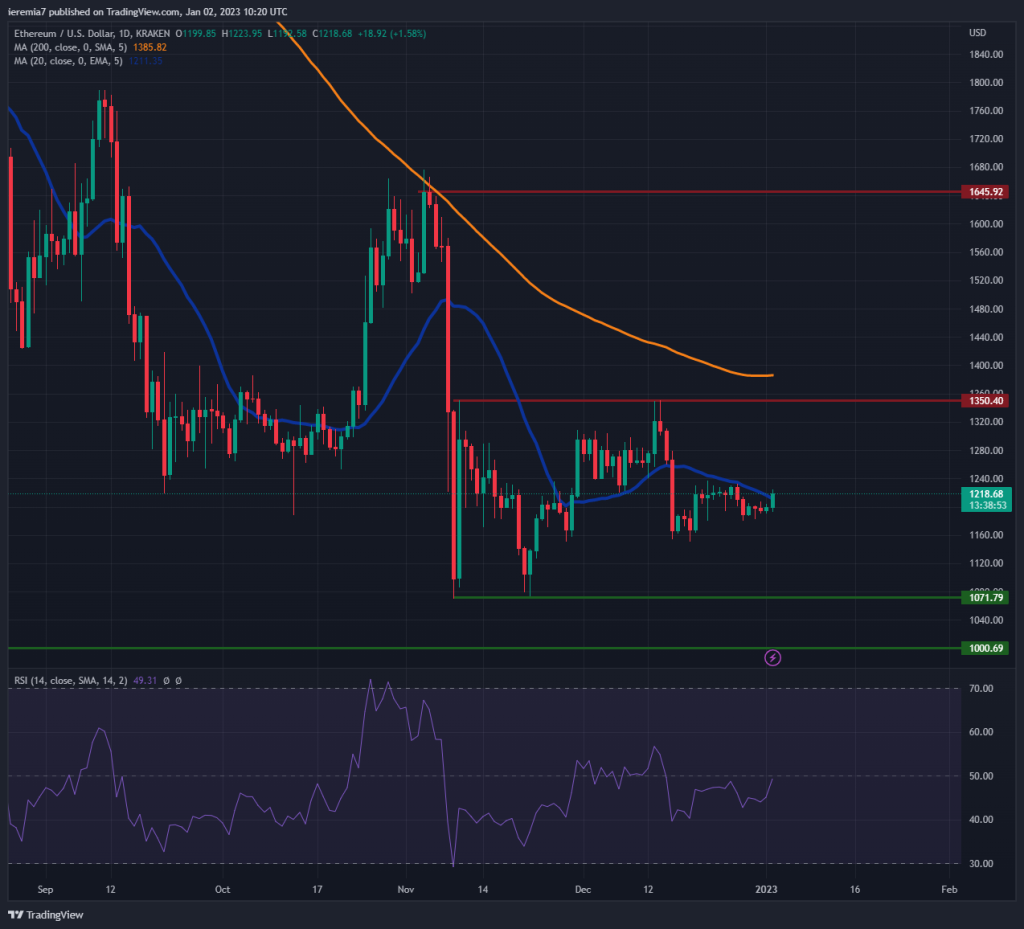
Moving on to Ether, technical conditions look similar. The price has been range-bound for the last two weeks, as the holiday season suppressed volatility. We think that will not be the case as liquidity is poised to increase by next week.
With that being the case, traders should watch for new developments, in particular, whether ETH manages to break above the daily 20 EMA. That can unlock more upside, at least towards the $1,350 resistance and the 200 SMA sitting little above.
The $1,150 is a temporary higher low, so as long as the market won’t break below it, the short-term outlook is slightly favorable for bulls. If a break does occur, then traders need to shift their attention toward $1,070. There are already two bounces off that level and buyers can show interest in it once again. Little below it we see the $1,000 key support.
LTCUSD (Coinbase)
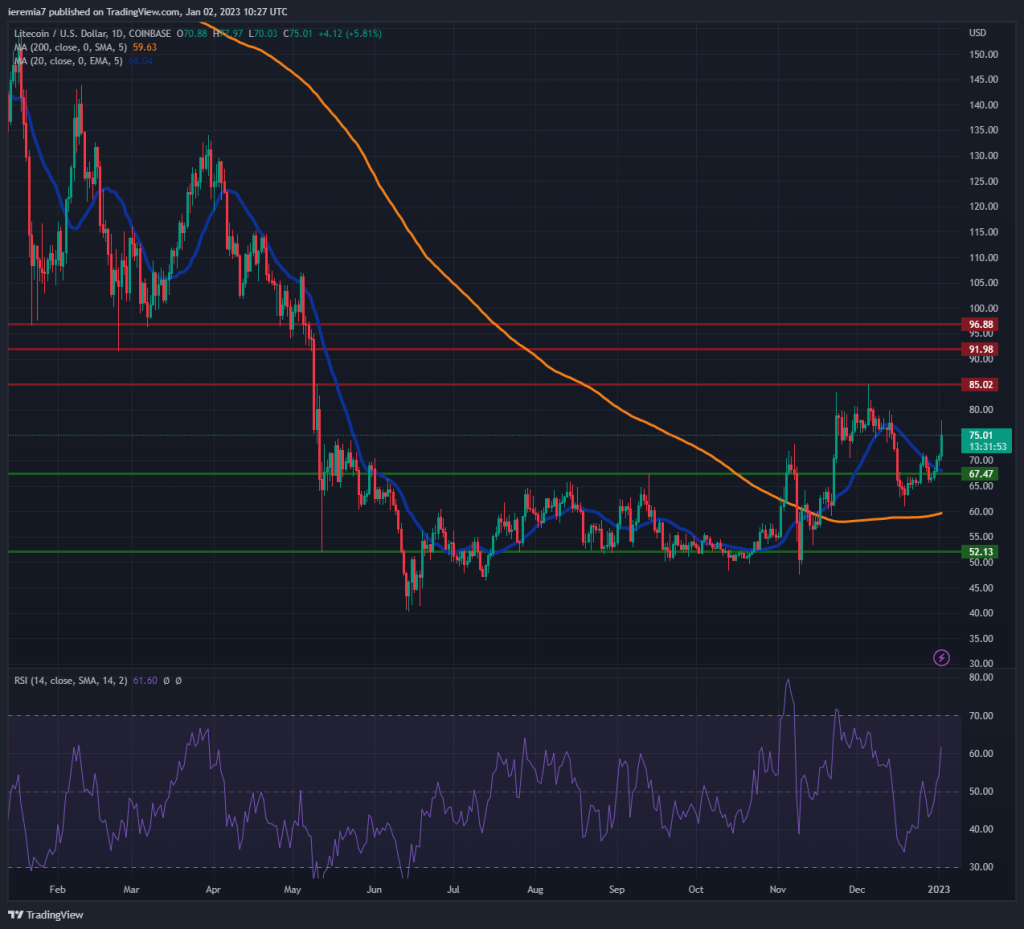
Litecoin is up 6% today, communicating there is significant interest in this token. Rightfully so, the price has been forming a bottom since June 2022 and now looks poised to continue up during January.
Despite the positive technical picture, traders need to carefully monitor some key levels. On the upside, resistance has recently been encountered around $85. Breaking above that could unfold more gains, probably towards $92 or $96. Crypto is still a volatile market, so it shouldn’t be a surprise to see LTC overshooting above $100.
We say the picture is bullish also because the price has been trading for a decent amount of time above the daily 200 SMA. That means an impulsive break below $60 will negate our views. You should watch for support around $52 as well, while a further dip below it will expose the 2022 lows. However, this doesn’t look like a high-probability scenario, given the bullish interest is easily noticeable.


There are no comments at the moment, do you want to add one?
Write a comment