BTCUSD (Coinbase)
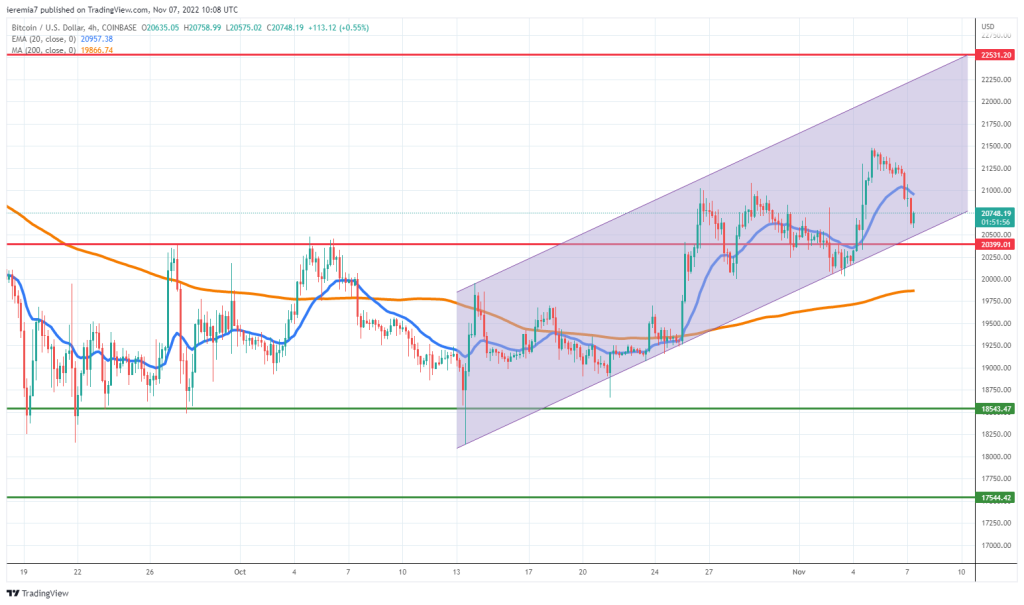
The past week has been rather choppy for Bitcoin and even if the price made a new high, touching $21,500, we are not yet convinced the order flow is favoring a strong upside move. Sellers have been actively selling the rips and despite better sentiment in the stock market, tokens like BTC fail to deliver.
However, from a technical perspective, Bitcoin is trading inside an ascending channel, which is why as long as the structure won’t be breached, the upside remains intact. We expect support to follow around $20,500, an area we’ve discussed in the past. Breaking below the channel would be a bearish development and the price could be headed towards $20,000 and the 200 SMA on the 4h chart.
With the US Dollar pressured, one could expect to see the price of Bitcoin rising. Such a move can happen as it’s just the beginning of a new week. In case we start to see gains piling up, $21,500 and then $22,500 will count as resistance levels. Buyers need to break above last week’s high to confirm they can push this market higher.
ETHUSD (Kraken)
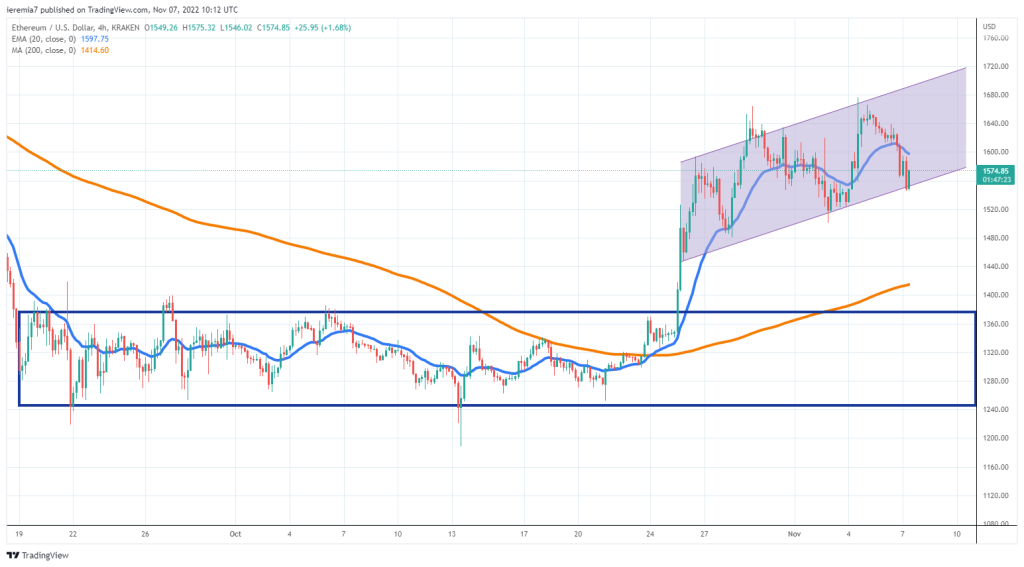
Ether broke a range on October 25th and since then buyers were the ones leading the charge. However, for over a week there has been a sense of uncertainty, as the price made new highs, yet the move was not convincing enough.
There is a lack of demand for crypto, probably because market participants lost faith as a result of this year’s bearish trend. At the same time, those trapped at higher levels are using moves on the upside as an opportunity to get out, which further diminishes the potential for a rally.
From our point of view, ETH is now trading inside a small range and only a break on either side could generate some volatility. Below the structure, we believe $1,400 might be revisited. On the upside, buyers could push the price towards $2,000, where stronger resistance is expected.
LTCUSD (Coinbase)
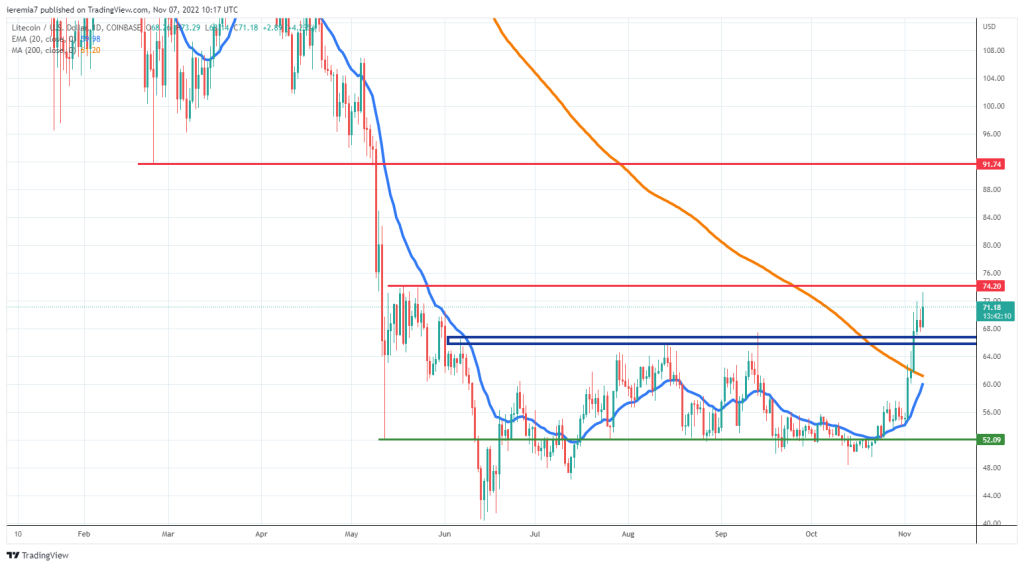
A token we did not cover for a long time, Litecoin is now seen rebounding, and with 26% returns over the last 7 days, this should be a token to watch. Technically, LTC broke an important resistance around $65 and that raises the prospects for a continuation higher in the next few weeks.
In case bulls can clear the resistance around $75, then they might have a clear path ahead towards $92, where a former February low can be spotted. The fact that Litecoin managed to break above the September highs is encouraging and even if cool heads must prevail, conditions are better now, as compared to a few weeks back.
The price trades above the daily 200 SMA, which is a bullish sign. Sellers should drive the price below it to have a chance, but at this point, $65 and $60 are areas where buyers will look to gain more upside exposure. Only a strong selling move can negate the current sentiment.


There are no comments at the moment, do you want to add one?
Write a comment