
BTCUSD (Coinbase)
Source: TradingView
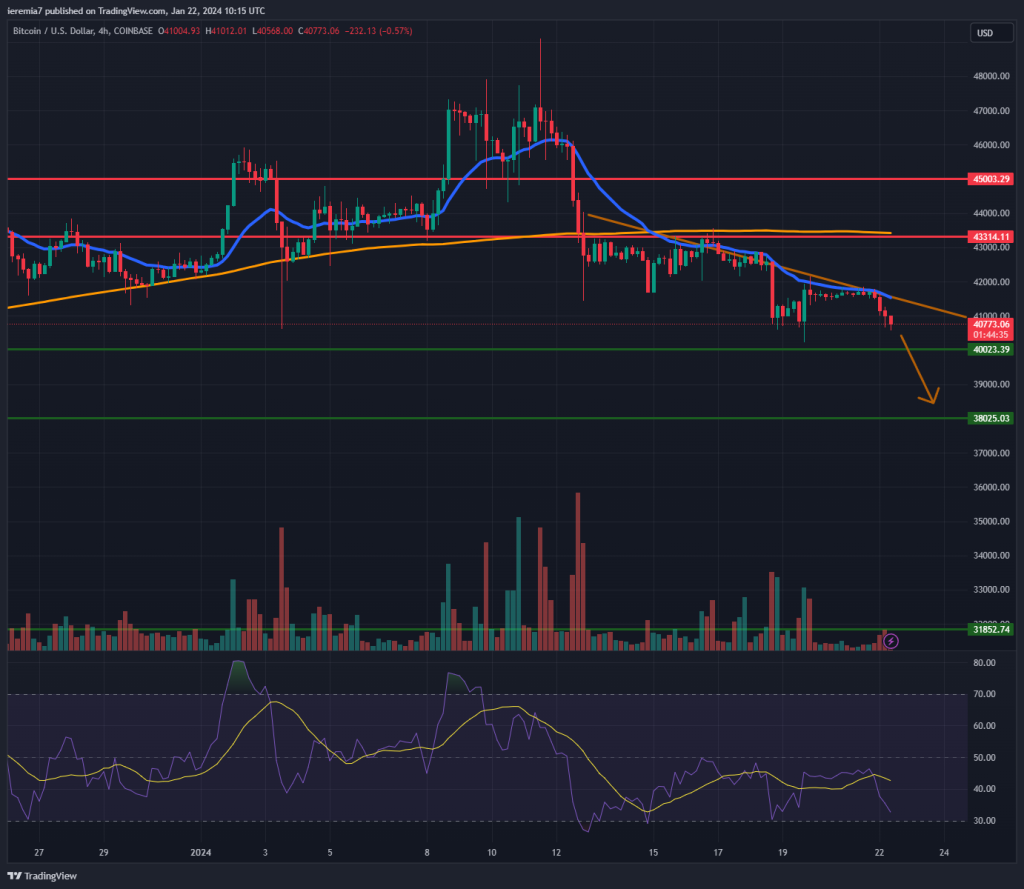
Bitcoin volatility is lower now and the price continues to slowly slide lower in the aftermath of the ETF saga. Despite interest in such instruments listed in the US market, the BTC price is no longer affected by this piece of news.
The market should shift attention to the halving as the next major event and you should be aware that volatility should pick up steam. We haven’t tested the key $40,000 support, but that might happen sooner rather than later. Looking at the 4h chart, the price is treating the 20 EMA as overhead resistance, which is good news for bears.
In case the price breaks and holds below $40k on the daily chart, that will be a short-term bearish sign. We reiterate that our next support is $38,000 and the likelihood of touching will materially increase if the pressure grows. The weakening sentiment is further reinforced by the rising US Dollar and rising Treasury yields. Based on all these factors, we maintain a slightly bearish stance for this week, as well.
ETHUSD (Kraken)
Source: TradingView
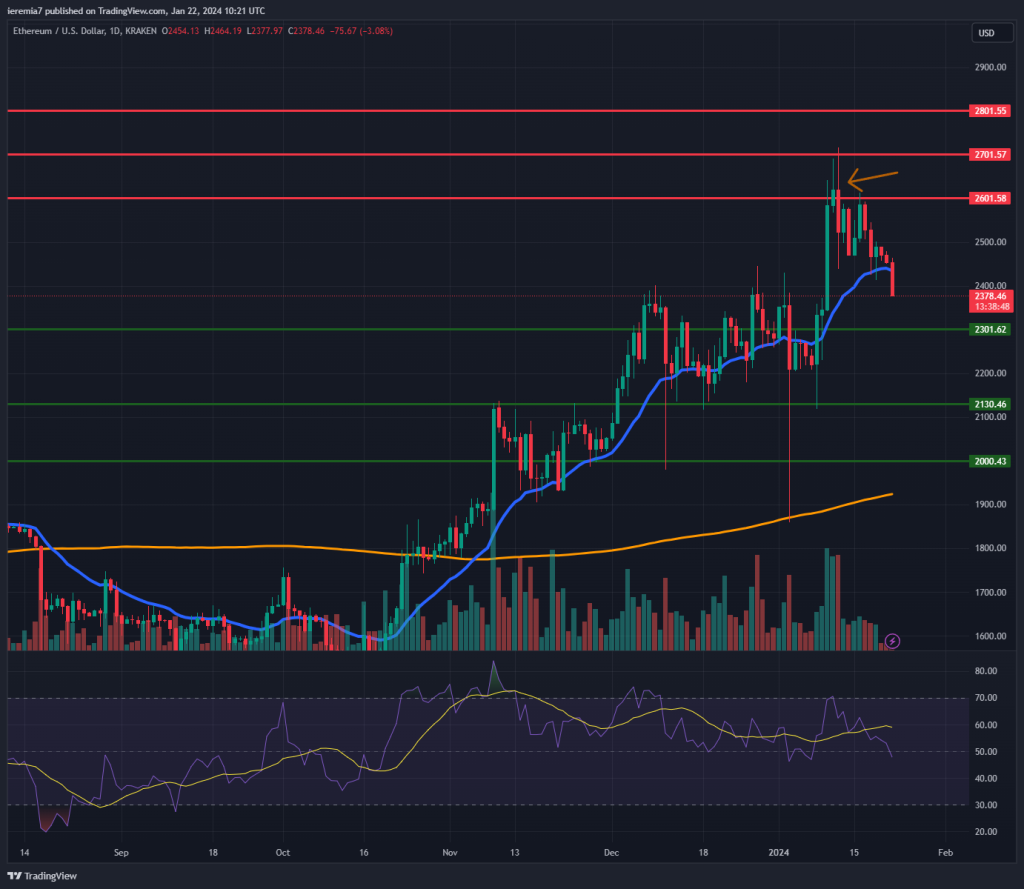
After a daily engulfing bar formed on the chart, there was little interest from Ether bulls. In fact, the price has weakened since that happened and now we are seeing weak support near the daily 20 EMA. Same as with Bitcoin, this coin benefited from heavy inflows for a couple of months and now it’s time for a break.
Crypto markets will remain volatile and sharp retracements shouldn’t scare traders, even if they occur in a larger bull trend. As things stand right now, we believe there’s scope for further Ether weakness. The next support line to watch is $2,300, but even that looks poor.
We expect more buyers to step in around $2,130 and $2,000. The benefit of waiting is that the daily 200 SMA will continue to rise, providing extra support in the face of stronger selling pressure. This market is in an uptrend as long as the price continues to trade above the orange line. However, term bearish setups can show up in the meantime.
LTCUSD (Coinbase)
Source: TradingView
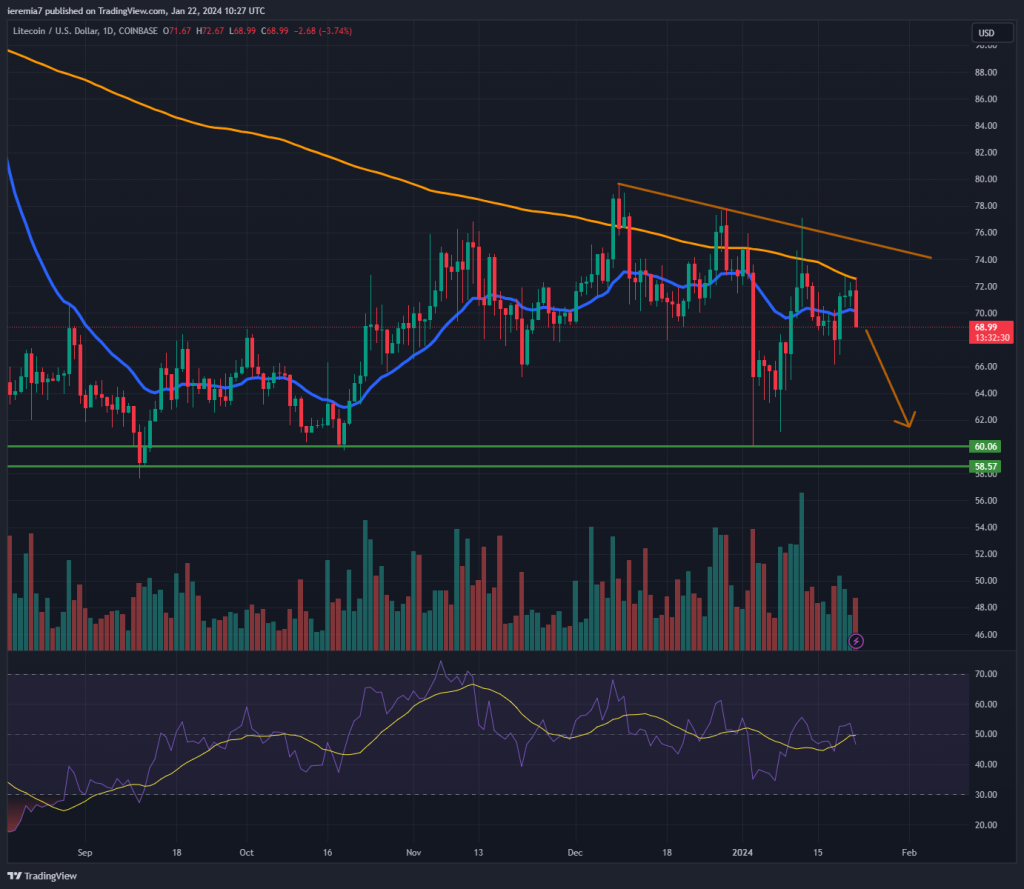
Litecoin is a token showing persistent signs of weakness when reaching the daily 200 SMA. As you can see from the chart, sellers step in aggressively around the orange line and that’s not an encouraging development.
Because of that, we expect selling pressure to continue to mount, especially if the broad sentiment will deteriorate further. LTC bounced off the $58.5 – $60 support area, but looking backward, the leg up is merely a corrective move, inside a larger bear trend.
As time goes by and Litecoin continues to reject the 200 SMA, we believe the odds of a continuation lower will increase. A new test of the $60 area will be a new chance for buyers to show that they want to drive this market up. Failure to do so can result in a deeper selloff towards $50.
As a whole, the market doesn’t look interested in LTC, so we advise bulls to remain cautious and only buy if the sentiment improves. A break and hold above the daily 200 SMA will be the clearest sign of a change of hands.


There are no comments at the moment, do you want to add one?
Write a comment