
BTCUSD (Coinbase)
Source: TradingView
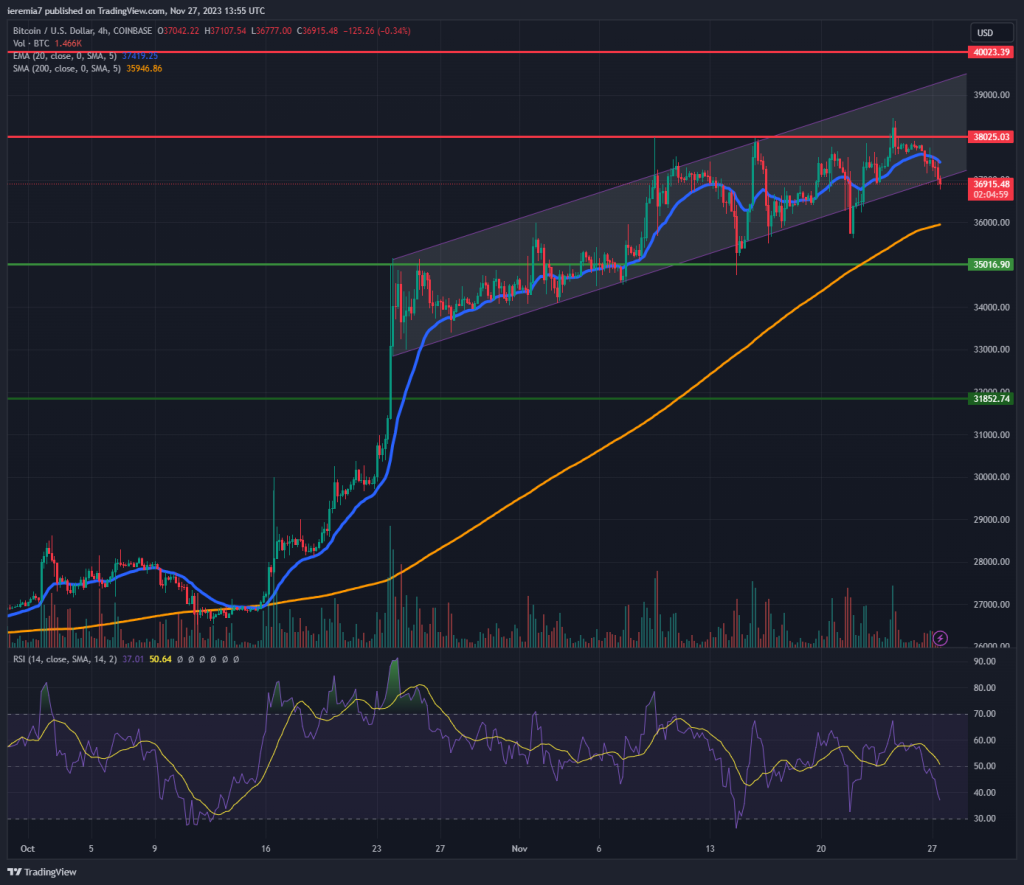
Bitcoin’s upside seems to be losing steam, although the price continued to move inside the channel we talked about last week. However, early signs of weakness are emerging, given sellers are already pushing BTC below the channel, meaning we might be at the start of a corrective move.
If that is the case, then sellers will finally get their expectations met. The first line of support comes at $36,000, where we can also see the 200 SMA on the 4h chart. Breaking below that will mean $35,000 is on the cards. Despite a temporary setback, it doesn’t mean the bull run ended. After all, Bitcoin is up substantially for the year and some traders want to take some profits off the table.
Moving on to the bullish scenario, in case BTC breaches $38,000 and closes above it on a daily basis, that will be a sign of bullish sentiment. As a result, the upside target would be $40,000, a key level highlighted by many other analysts as well.
ETHUSD (Kraken)
Source: TradingView
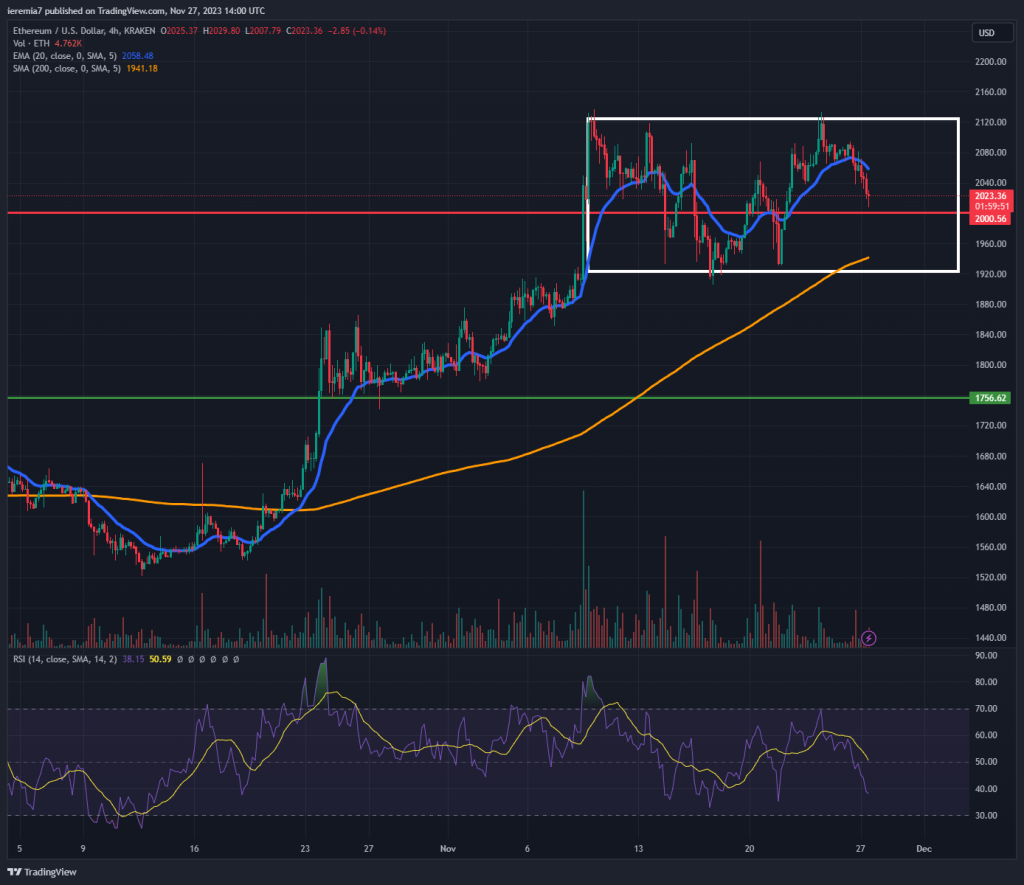
In line with Bitcoin, Ether is also range-bound, suggesting once again that the broader market is taking a breath after the impulsive run higher. Traders generally struggle during times of consolidation, but that shouldn’t be the case if they focus on key support and resistance levels.
The upper side of the range currently sits at $2,120. We can already see several rejections off that zone, suggesting there is high enough selling pressure to stop a continuation of the bull trend. This means you might want to consider fading short-term moves towards that level.
On the downside, $1,920 is the bottom of the range, yet traders should not ignore the $2,000 psychological level. In case we see a break below $1,920, that can be an early indication of a deeper pullback. As a result, Ether could weaken towards $1,750.
BNBUSD (Binance)
Source: TradingView
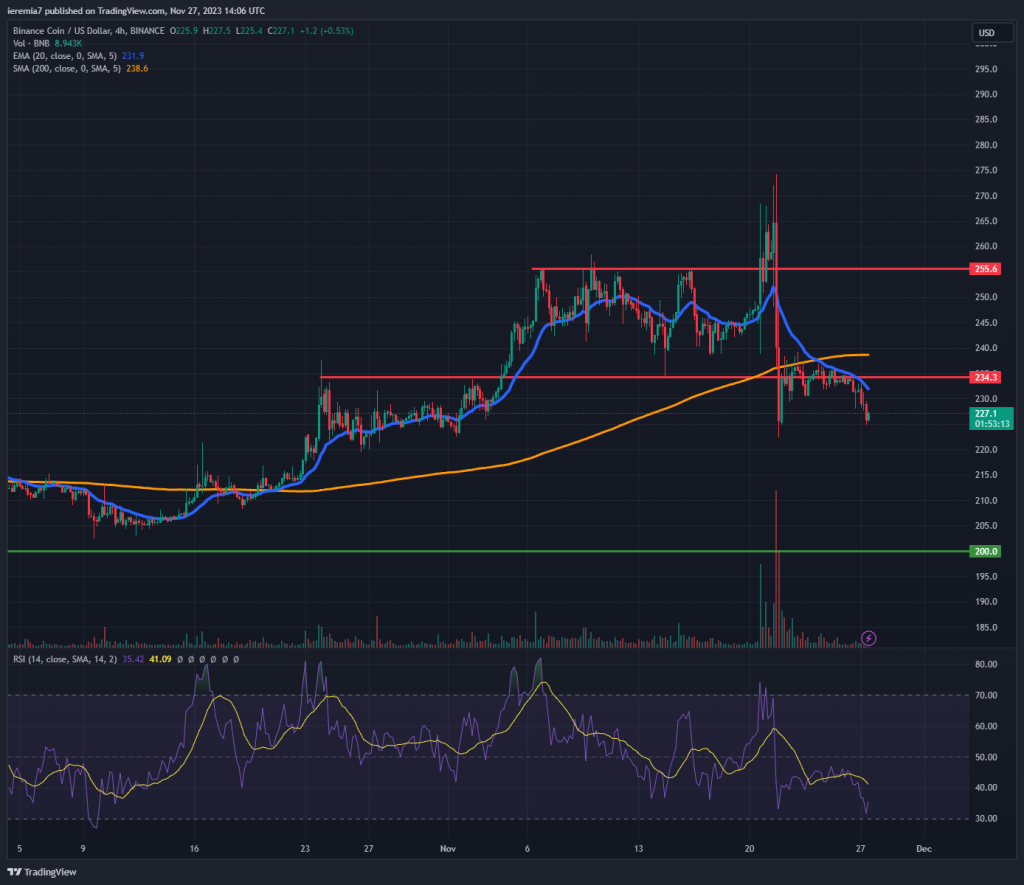
The latest regulatory hurdles of Binance brought BNB under scrutiny. We can see on the 4h chart how the market sold off the coin impulsively once news broke out that the exchange had settled with the US regulators. Also, the CEO was forced to step down and this only adds up to the long list of crypto companies that had such issues.
Switching back to the technical picture of BNB, it doesn’t look good at all. The major bearish engulfing candle and the follow-through selling suggest there is little appetite to get long at this stage. Taking that into consideration, we think traders might want to fade short-term bullish corrections. The $234 and $240 resistance levels look like attractive places on the chart.
As things stand right now, we believe it’s possible to see BNB weakening towards the $200 support in the weeks ahead. Don’t forget this coin is heavily underperforming the broader market.
One should not exclude a push higher. Before we shift our sentiment to bullish, we want to see the price breaking and holding above the daily 200 SMA. Even if that happens, sellers are expected to rejoin around $255.


There are no comments at the moment, do you want to add one?
Write a comment