
BTCUSD (Coinbase)
Source: TradingView
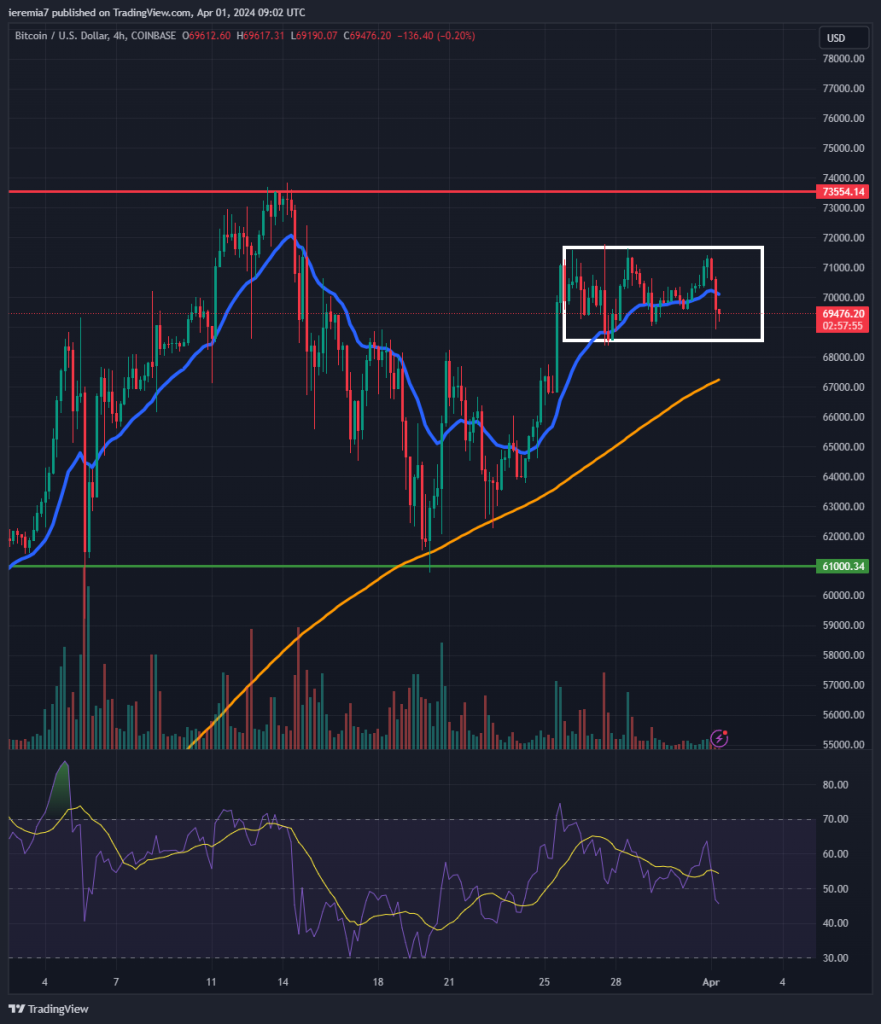
We were right about the compression of volatility due to the Easter holiday and as you can see from our chart, Bitcoin has been trading between $68.5k and $71.5k. Neither bulls nor bears were able to generate a clear directional move, but as activity picks up again in the upcoming days, we should start to see changes.
Be aware that the widely anticipated halving will happen this month and volatility will definitely spike at some point. Since most market participants are well aware of it, we could see some sell-the-fact activity.
In terms of technicals, if the range breaks on the upside, the next resistance line to watch is $73.5k. Above that, $75k is next in line as a clear psychological level. Bitcoin is still in an uptrend, so we favor a higher continuation.
Renewed selling pressure needs to be capped by the 200 SMA on the 4h chart. If that won’t happen, we expect a deeper correction down to $61k – $60k. We can see two instances when strong selling stalled there, so traders need to watch the area carefully.
ETHUSD (Kraken)
Source: TradingView
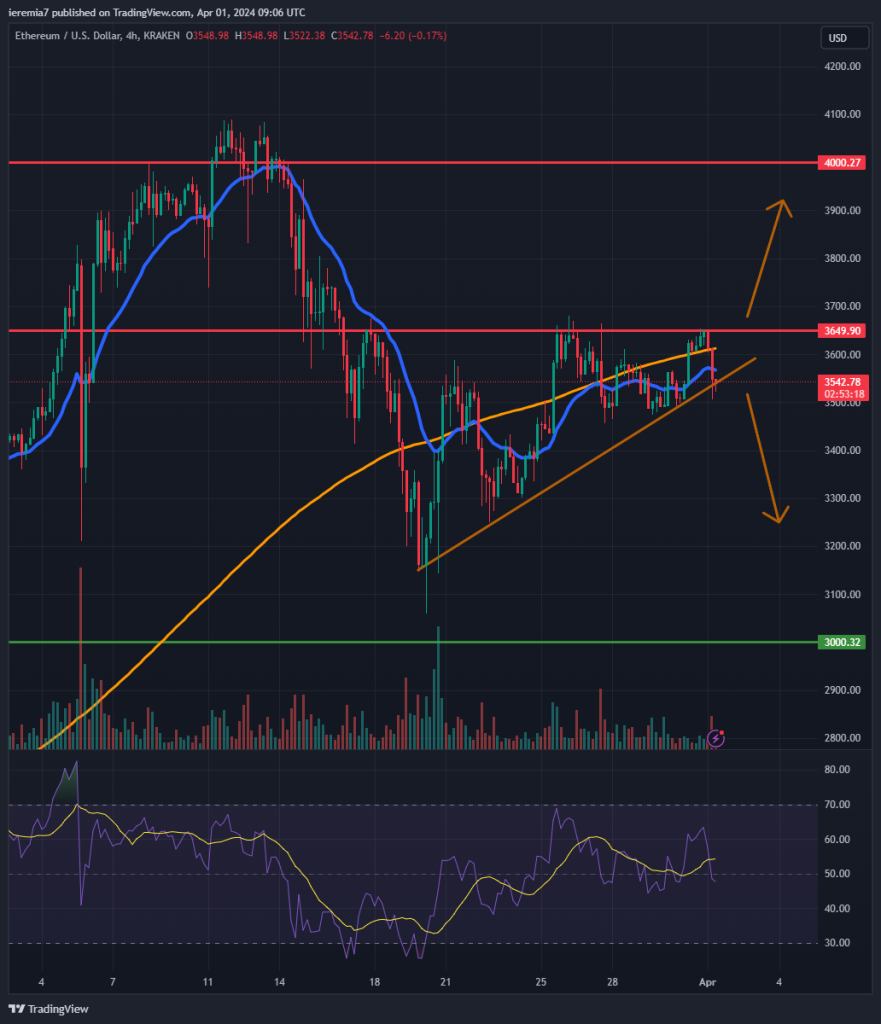
Ether struggles to find the next direction as it chops above and below the 4h chart 200 SMA. Additionally, we see a short-term ascending trend line that has capped the downside since March 20th.
Buyers entered at higher levels, but up to this point, $3,650 turned out to be a strong resistance level. If that finally breaks, then we suspect ETH is poised for a new bullish leg that will likely retest the $4,000 key resistance level.
If sellers end up as winners and the price moves well below the 200 SMA, then the support line to be watched is $3,000. We believe larger buyers will wait for a deeper pullback before stepping in. As a result, $3k means ETH would be a little over 25% below the all-time high, providing more room for upside, when the next impulsive move unfolds.
BCHUSD (Coinbase)
Source: TradingView
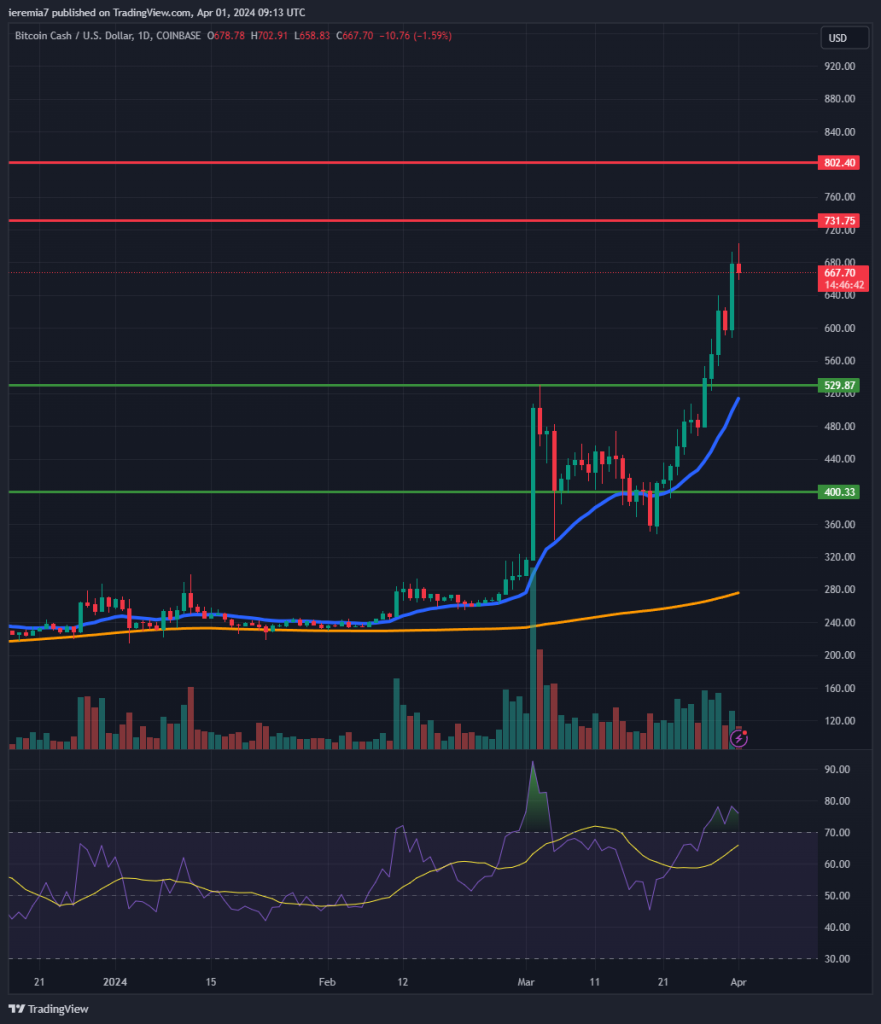
As the overall market remains quiet, attention seems to have shifted towards Bitcoin Cash. The 14th largest coin in the world by market cap is up 37% in a week, suggesting heavy buying. Looking at the chart, the impulsive move up cleared the $529 level, which was a prior high for the year.
Traders chased the market up after the break and now the price is getting close to $731, the next resistance where we expect potential weakness. $800 is another area to watch in case of an overshoot.
Because these two key levels are not far from the current price, buying at this stage is not optimal from a risk management perspective. With that in mind, traders might want to wait for a pullback towards the daily 20 EMA before placing new bids.
A move lower retesting $529 would also be a great opportunity to increase exposure. In case selling turns out to be heavy, $400 is another major support line. Overall, as long as BCH trades above the daily 200 SMA, we think there’s scope for further gains in the mid-term horizon.


There are no comments at the moment, do you want to add one?
Write a comment