
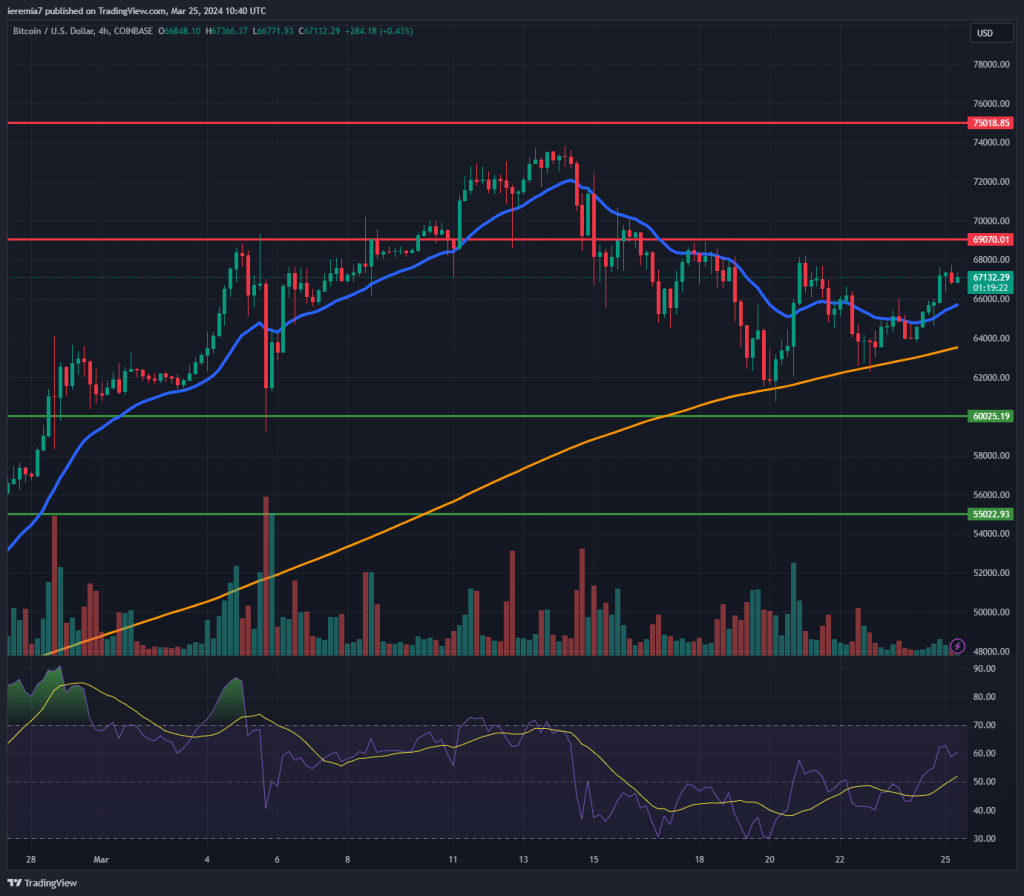
BTCUSD (Coinbase)
Source: TradingView
The 4h chart suggests that Bitcoin weakness bottomed around the 200 SMA. As you can see from the chart, the price bounced twice after touching the orange line, suggesting there were strong buyers there.
Also, the RSI retraced from overbought conditions and now buyers are better positioned to add up to their exposure. Keep in mind that we are gearing towards the Easter holiday and daily ranges could be subdued this week.
Still, the near-term resistance area to watch is $69,000, where the 2021 ATH is located. Managing to break above it will be a clear sign of bullish optimism and the price can move up from that, towards the $75,000.
April 20th is a date to mark on your calendar because that’s when the halving will take place. Based on past occurrences, volatility should spike around the event and Bitcoin is expected to post both gains and losses, requiring caution from traders.
For now, we view $60k as a clear support area and if that fades, $55k will follow. There is increased chatter about that level online and maybe the market will move towards it due to elevated levels of liquidity.
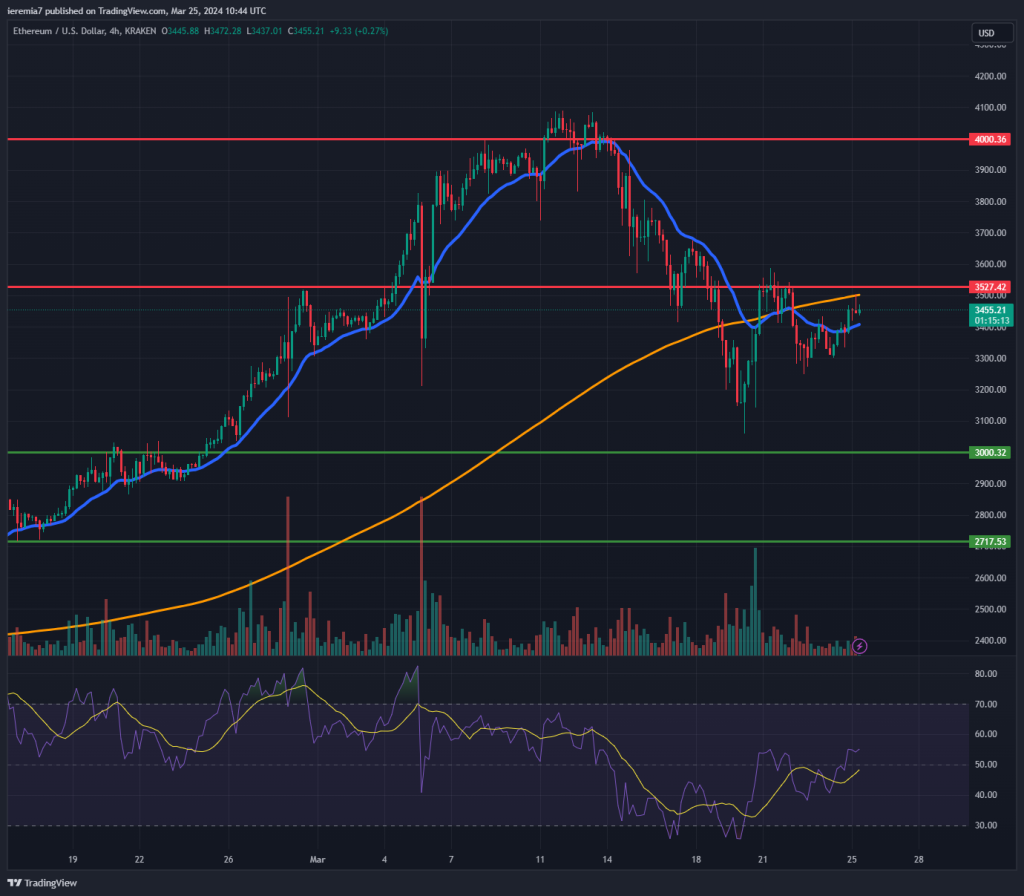
ETHUSD (Kraken)
Source: TradingView
Ether is in a worse technical position when compared to Bitcoin, simply because the 4h chart 200 SMA failed to cap the downside. Despite a bounce off $3,100, the coin retraced 25% from the high reached on 12th March, suggesting when sellers hit the tape, they can drag the market down substantially.
Anyway, we are now waiting to see whether bulls can push the price above $3,500 and the 200 SMA. That’s a confluence of indicators and further gains above could revive hopes for a second $4,000 retest.
If not, Ether is poised for more weakness in the near term and the attention will shift to the $3,000 support. That’s a key psychological level where we expect a stronger reaction from the bull side. The RSI is moving up for now and that means the market started the week with positive momentum.
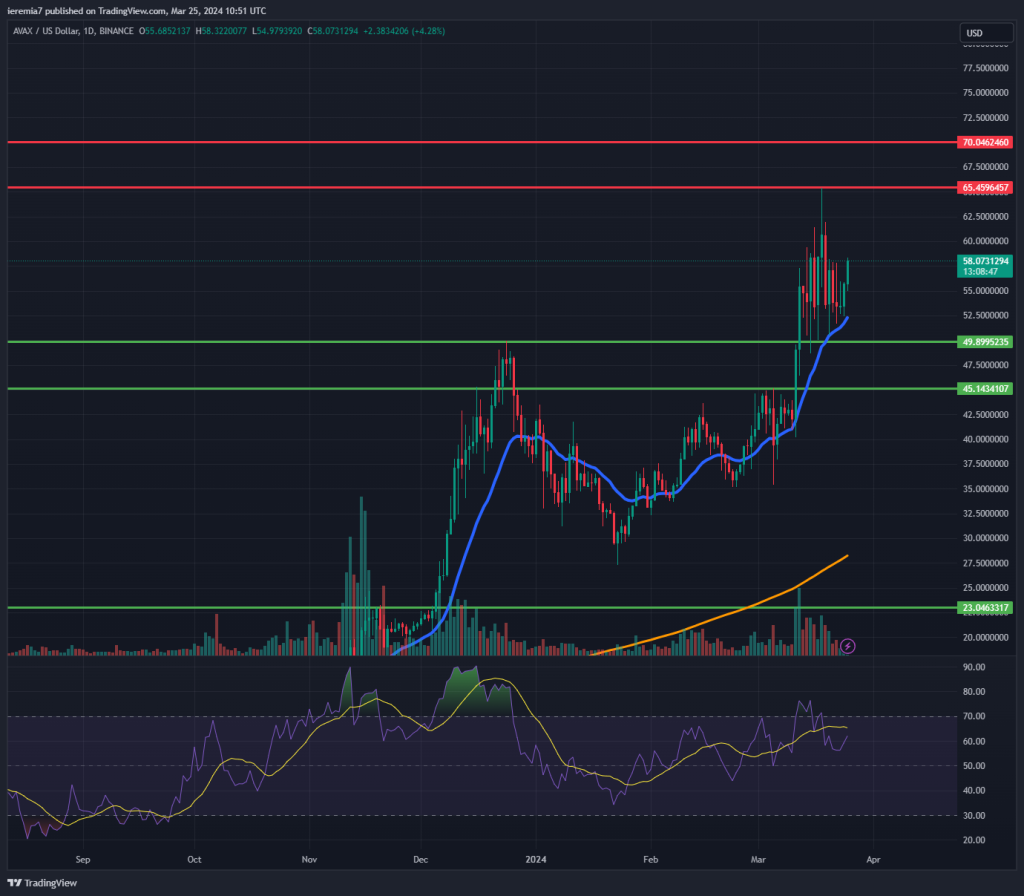
AVAXUSD (Binance)
Source: TradingView
Avalanche is in a very good technical position. Breaking above the $50 level was a key development for buyers and as the market retraced to that level, buyers balanced the order flow. At the time of writing, the price is trading above the daily 20 EMA and is heading up, suggesting we could see AVAX retesting this year’s high in the short term.
The $65 and $70 are our main levels of resistance moving forward and we advise traders to watch for new price action clues around them. The bullish trend is solid and until we see meaningful and sustained selling pressure, there is no reason to believe this market will reverse.
That doesn’t mean you shouldn’t prepare for a bearish scenario. Our first red flag would be a breakout below the $50 area. $45 follows next, but if selling picks up steam, the best position for bulls would be closer to the daily 200 SMA. As we’ve already seen with Ether, 25% corrections can happen in a matter of days, so it’s better to not try to catch a falling knife.


There are no comments at the moment, do you want to add one?
Write a comment