
BTCUSD (Coinbase)
Source: TradingView
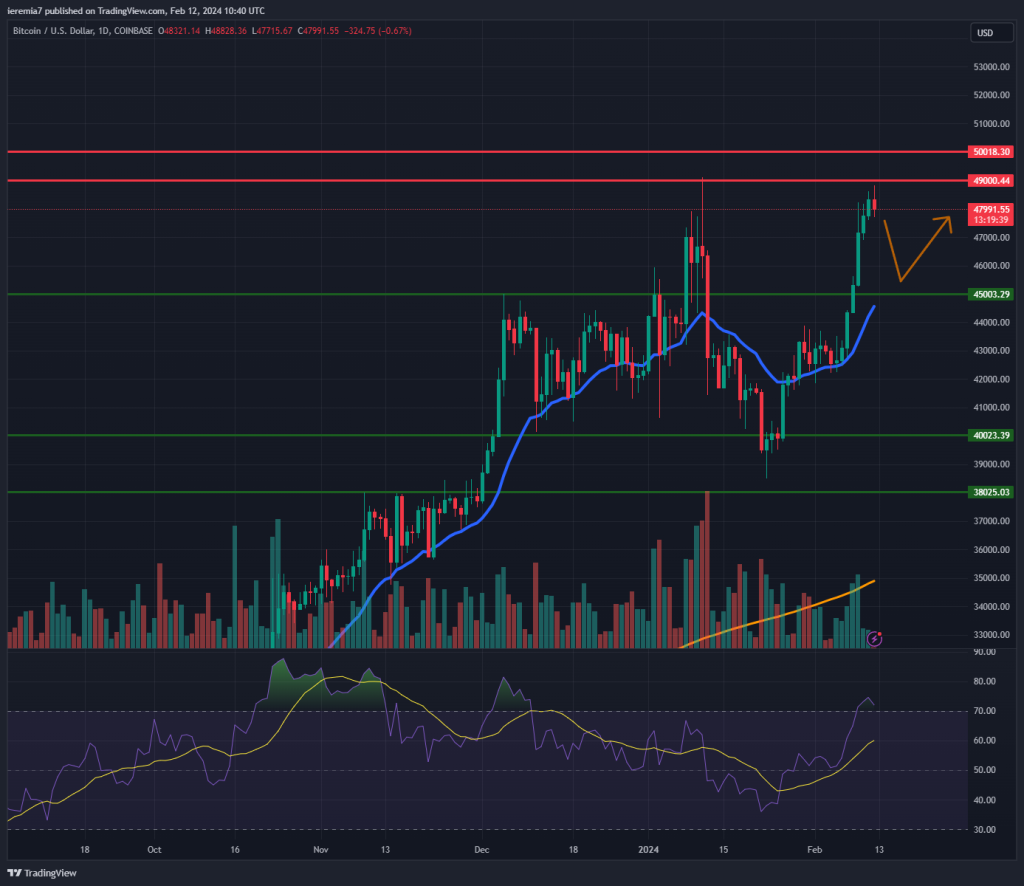
A couple of weeks ago we highlighted the $45,000 area as key resistance and that the bull trend will only resume on a break above. The potential for a head and shoulders pattern is now negated and the prospects for a continuation towards 50,000 have improved dramatically.
At the time of writing, BTC is showing a slight profit-taking after it almost touched the January 11th high. Buyers who are late at the party might want to wait for a deeper pullback, close to the $45,000 support and the daily 20 EMA.
The RSI is slightly overbought, but that doesn’t mean a reversal is imminent. The indicator can trade above 70 for an extended period. Moving forward, the main resistance levels are $49,000 and $50.000. We believe the latest gains come from growing anticipation for the April halving event.
Based on the current price action, expecting a major trend break to the downside is not advised. We would have to see massive selling and a breakout below the daily 20 EMA as a first sign of weakness. Until BTC breaks below $42,000, there is scope for further upside.
ETHUSD (Kraken)
Source: TradingView
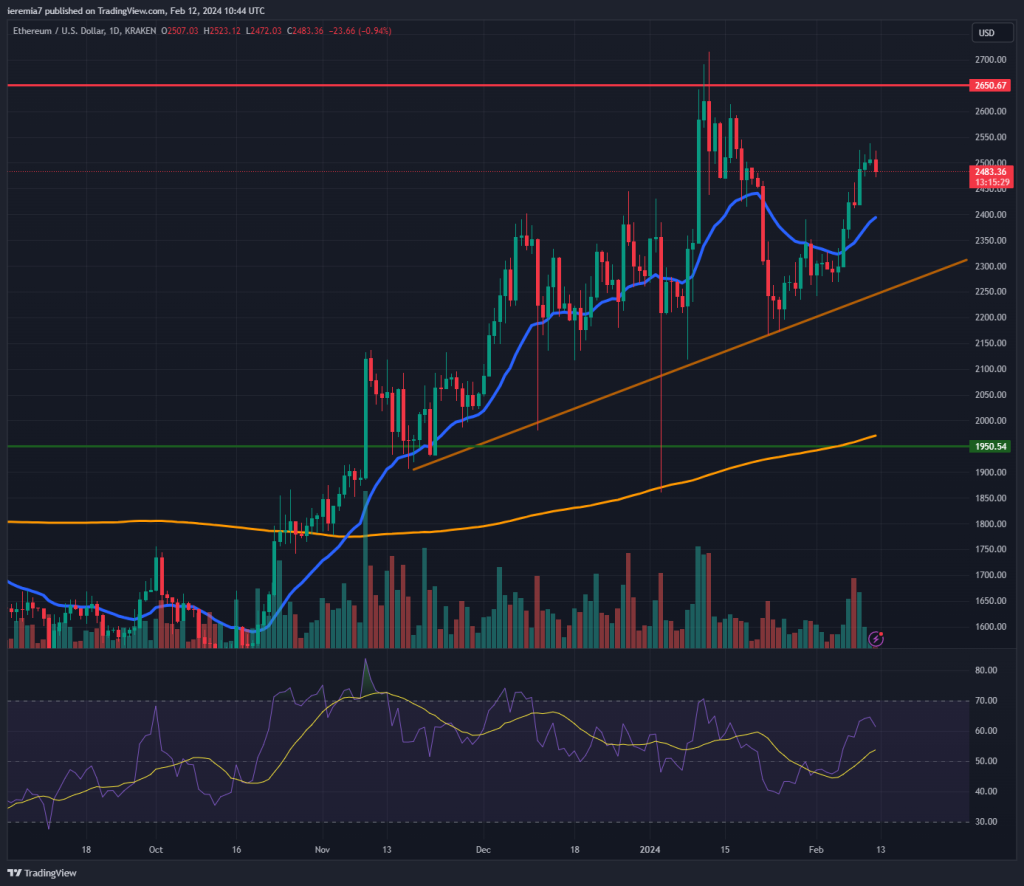
Despite a mild setback after touching the $2,500 area, Ether is also showing signs of strength. This coin shows a positive correlation with Bitcoin, so as long as the market remains upbeat, more gains could follow.
We have also flagged the potential for an H&S pattern here, but since the price broke above the left shoulder line, that seems less likely now. Due to the price action seen during the last couple of days, it’s possible ETH could extend higher towards $2.650 – $2,700.
On the downside, you can notice an ascending trend line that continues to support the market. A decisive break and hold below it would be a warning sign. In that scenario, we expect Ether to weaken towards the daily 200 SMA and the $1,950 key level. Volatility has picked up and that’s good news for short-term traders.
AVAXUSD (Binance)
Source: TradingView
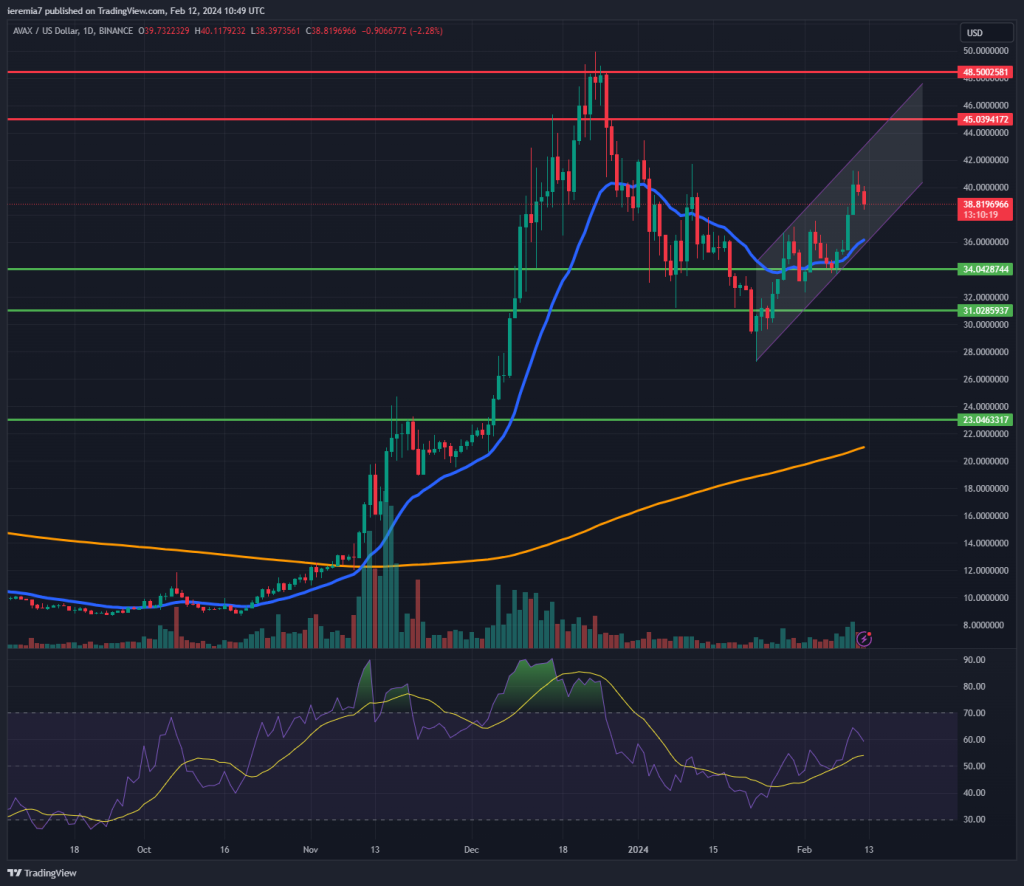
Although Bitcoin was an outperformer last week against major coins, some other projects like AVAX are posting gains. Following the major surge last year, Avalanche retraced a good portion of the gains, only to find support around the $30 area.
Since then, the market recovered and it’s now gradually moving up in a bullish channel. As long as the structure remains intact, we believe the price can continue to climb toward the $45 – $48 key resistance area.
Bears can drive the market lower at any point, but support is expected around the 20 EMA on the daily chart, which coincides with the lower bound of our channel. Below that confluence of indicators, we treat $34 and $31 as other notable support areas.
Overall, because this token gained in value a lot last year, we should see a retest of those highs. The buying interest was very strong and as AVAX became cheaper, traders were interested to buy once again. As always, the broad market sentiment matters for altcoins, so you should monitor that as well.


There are no comments at the moment, do you want to add one?
Write a comment