Ripple
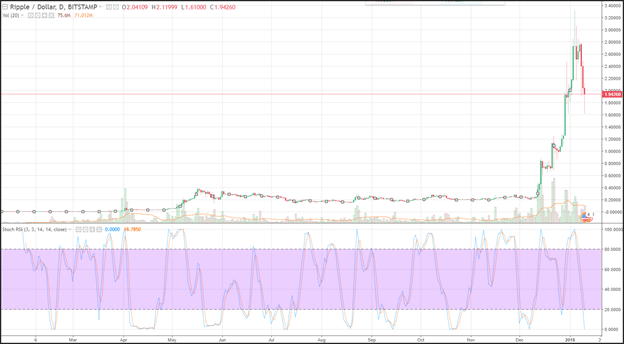
Ripple prices tumbled during the first week of January and in addition to profit taking, traders were negative XRP following an announcement from Coinbase that they would not put Ripple on their GDAX trading platform. Coinbase is the largest cryptocurrency wallet in the United States. In the wake of the news, prices dropped nearly 30%, but appeared to have bounced near the 10-day moving average at $1.6. Prices took off in early December climbing from $0.20 to nearly $3.35.
When prices surged, they moved into overbought territory. That’s because the RSI (relative strength index) which is a momentum oscillator that measures accelerating and decelerating momentum as well as overbought and oversold levels, climbed above 70 and then corrected. Currently, the RSI is printing a reading of 18, well below the oversold trigger level of 30 which could foreshadow a correction in Ripple prices.
Source Tradingview.com
Bitcoin
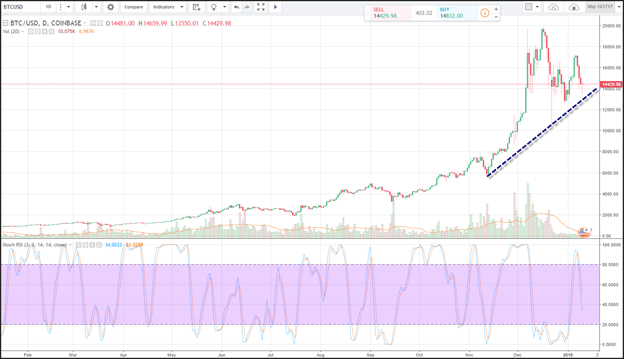
Bitcoin prices moved lower and are now unchanged for January. Prices were on a tear until mid-December, and since have been forming a topping pattern. Now that CME and CBOT traders can short Bitcoin, prices can face resistance as traders step in to short the Bitcoin market. Support for Bitcoin is seen near an upward sloping trend line that comes in near 13,750. Resistance is seen near the January highs at 17,174. The pattern is a topping pattern, as the highs generated in early January were unable to take out the highs made in mid-December. Momentum is negative as the RSI is moving lower in tandem with price action. The current reading on the RSI is near 38, which is on the lower end of the neutral range and reflects consolidation.
Source Tradingview.com
Litecoin
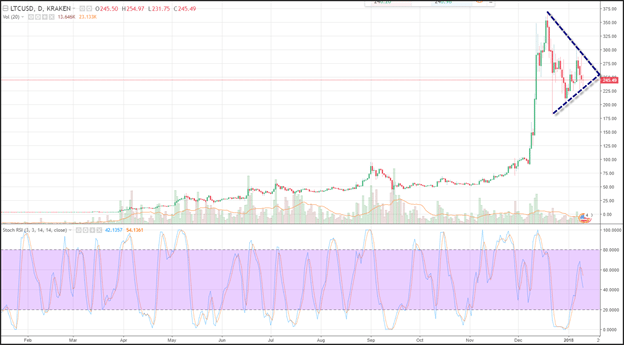
Litecoin prices have experienced whipsaw price action. Prices are forming a wedge pattern which is a consolidating pattern and likely that pauses then refreshes higher. Prices are forming tighter ranges as energy build up in the wedge and a break of either support or resistance will likely see strong follow through. Resistance is formed from a downward sloping trend line that connects the highs in December to the highs in January and comes in near 290. Support is seen near an upward sloping trend line that was tested at 230. The relative strength index (RSI) is printing a reading of 50 which is in the middle of the neutral range that reflects consolidation.
Source Tradingview.com
Ethereum
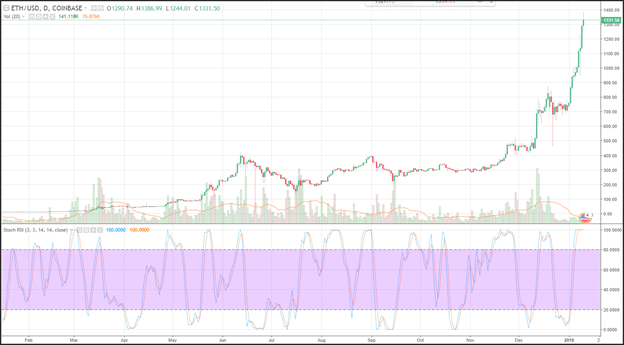
EthereumRipple prices were the standout for the week surging higher during most of January as trader’s sentiment were buoyed by positive comments from Ethereum app developers. Prices have jumped more than 75% in January, and are now overbought. The relative strength index (RSI) surged higher reflecting accelerating positive momentum, but the current reading on the RSI is 100, well above the overbought trigger level of 70 and could foreshadow a correction in prices. The last time the RSI hit 100 in November prices consolidated before running up even higher.
Source Tradingview.com


There are no comments at the moment, do you want to add one?
Write a comment