
BTCUSD Coinbase
Source: tradingview.com
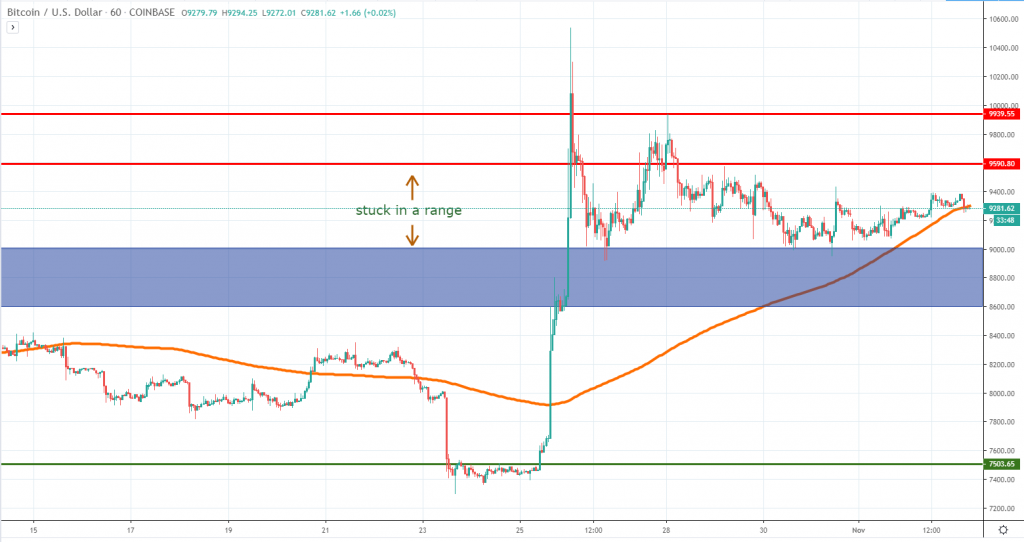
As we’ve expected, the Bitcoin price did not manage to continue higher at the same impulsive pace and instead, in consolidated in a range for the past week. In our previous analysis, we’ve highlighted that the $9,000-$8,600 area will serve as support and so far, $9,000 had been the place where buyers stepped in.
Since the break outside of the range did not take place, we assume sellers will rejoin the market around $9,600, in case the buyers will continue to push the price higher. Above it, $9,350 should be another level to watch.
On the flip side, we continue to reaffirm that $9,000-$8,600 will remain a key support area and only on a strong break below we could see further selling and potentially all the gains erased. Given the current circumstances, we don’t think any breakout will take place during the next week and market participants will continue to remain undecided.
ETHUSD Kraken
Source: tradingview.com
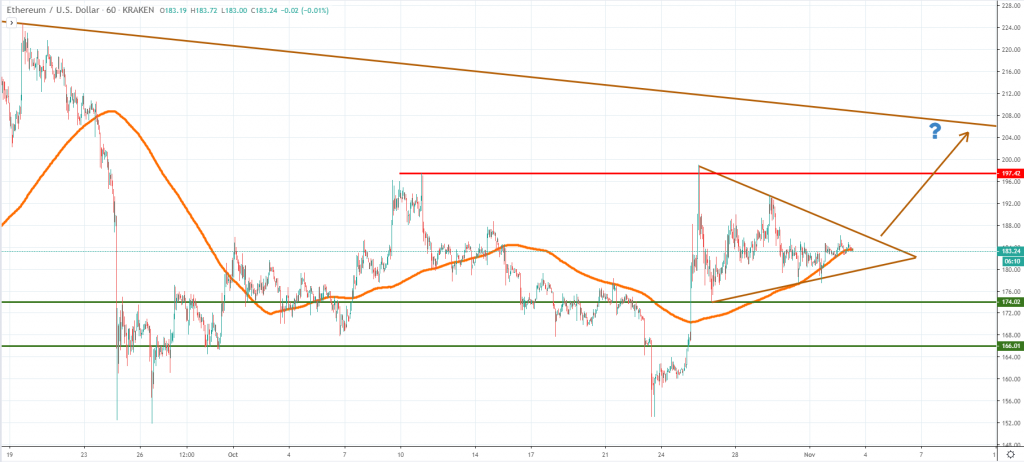
Same as Bitcoin, Ether failed to generate further momentum during the past week and consolidated in a triangle formation. From our point of view, this could suggest the price is likely headed for a breakout higher, given that the consolidation comes after an impulsive move + after generating what we assumed to be a double bottom formation a week ago.
If our forecast will materialize, then Ether will head towards the $197 resistance area and most likely, towards a falling trend line which we’ve talked about during the past few weeks. That means our mid-term target for ETHUSD stands around $205.
In case we’ll be wrong and the triangle will break on the downside, then Ether will be most likely headed towards $174 or $166 support levels. Let’s see how the price action will unfold, with caution that things might get choppy as the triangle is almost filled.
BNBUSD Binance
Source: tradingview.com
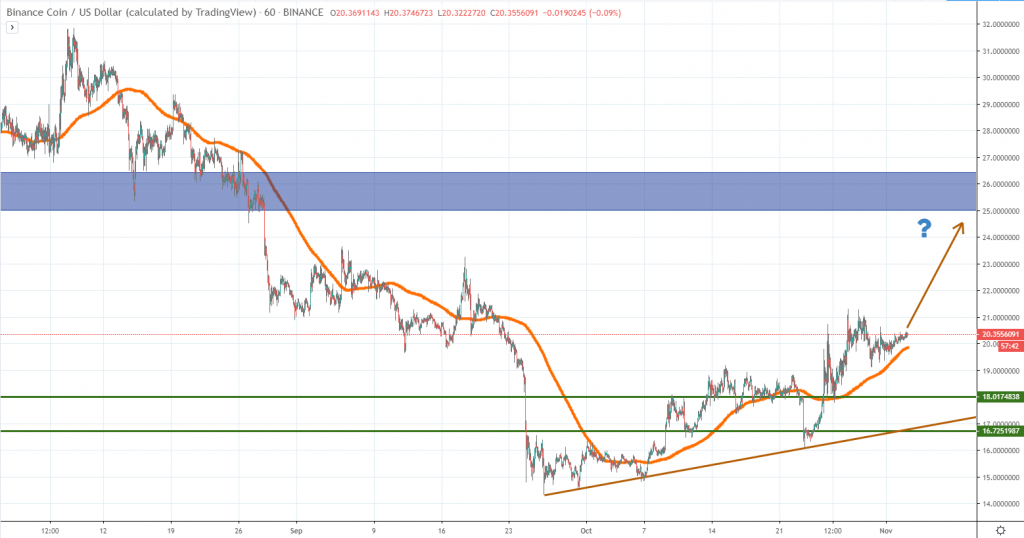
We did not cover Binance Coin since the summer, given that the price action broke below a key support area located around $25-$26.5. However, since the beginning of October the price action started to bottom out, resulting a nice bullish parabolic structure.
At the time of writing, the price trades above the 1h chart 200 MA and above the $16.7-$18 support zone, which makes us confident that the mid-term target is located around the key broken area mentioned above. BNB could encounter short-term resistance around $23, but everything looks set for a continuation higher.
It’s not excluded that minor setbacks might happen, but as long as the price won’t break impulsively below the ascending trend line on our chart, our bullish bias will remain in place. Such a breakout will negate our view and will open the door for further losses as 2019 draws to a close.
Briefings about ICOs
Until November 11th, LifeTask will continue to run its ICO, in order to build a blockchain-based and decentralized matching platform, using artificial intelligence, smart contracts, and secure data.
Flas Exchange is a highly promoted upcoming ICO that will start on December 9th. It has been developed by a UK-based company and wants to build a comprehensive trading platform for various types of digital assets.


There are no comments at the moment, do you want to add one?
Write a comment