
BTCUSD Coinbase
Source: tradingview.com
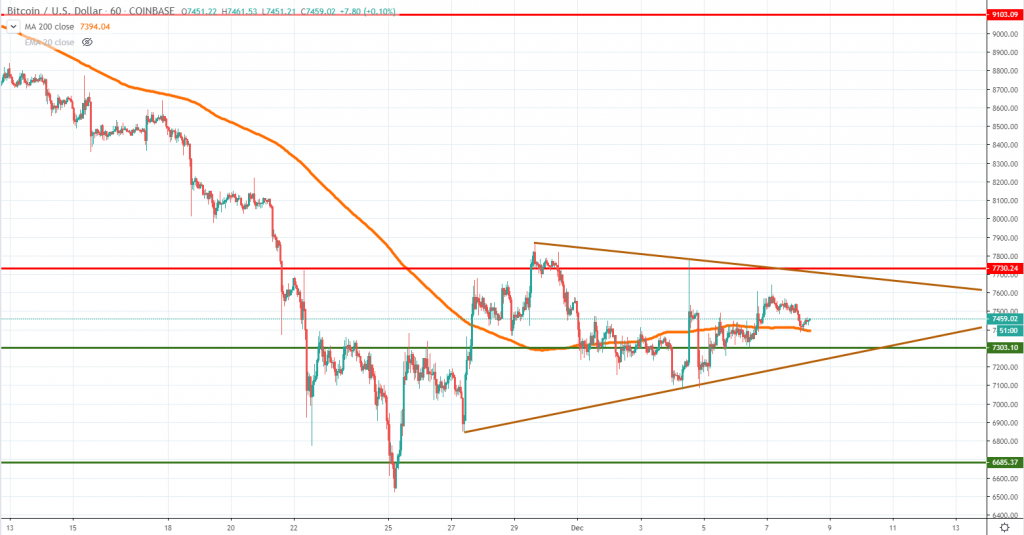
Volatility seems to have settled, at least in Bitcoin’s case, given that we have the price trading in a triangular-type formation. The $7,700 resistance area mentioned a week ago held pretty nicely and the next key thing to watch will be the direction of the breakout.
We anticipate the Bitcoin will start to move impulsively once again before Christmas Eve and how the triangle structure will be broker will determine the winner (bulls or bears). If the triangle will be broken on the upside, we should expect Bitcoin to continue on its way higher towards $8,500 or $9,000 area by the end of the year.
On the other hand, a breakout lower will be a bearish sign and could mean that the November lows, located around $6,500 could be revisited again. We believe that the upside is slightly more favored now, but let’s not rush and see what the market will tell us.
ETHUSD Kraken
Source: tradingview.com
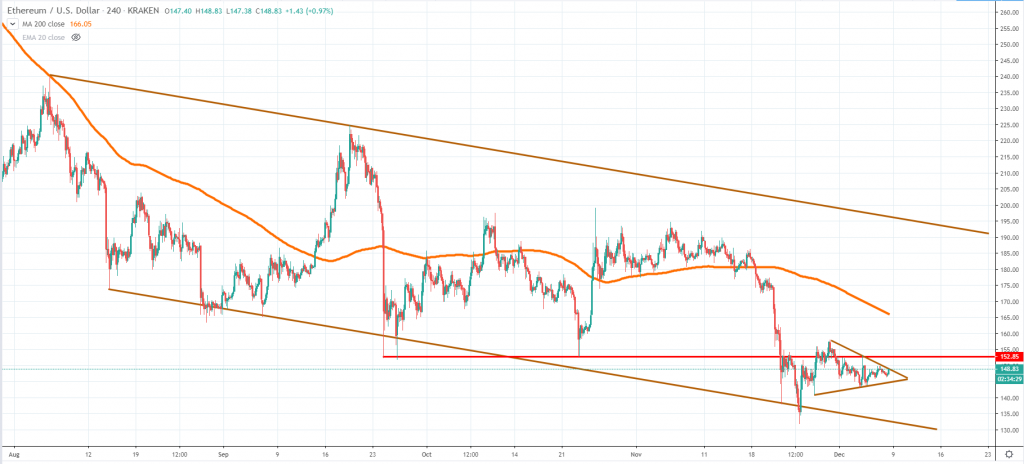
The correlation between Bitcoin and Ether is back at its peak since we can see here as well a triangle consolidation pattern. We must highlight that Ether continues to trade inside the bearish channel formation mentioned a few weeks ago and that caps the potential downside looking ahead.
In this case, though, we’re talking about a much smaller pattern that’s almost filled, which means that the Ether breakout could happen sooner. The only downside, however, is that the price remains below $152, a key resistance area mentioned last week. A breakout above it will give buyers more confidence ahead.
If the triangle will break on the downside, the selling should be capped by the lower line of the channel, located around the $135-$130 area. Bear in mind that we could see some choppy activity ahead, given that we’re during the weekend.
STRUSDT Poloniex
Source: tradingview.com
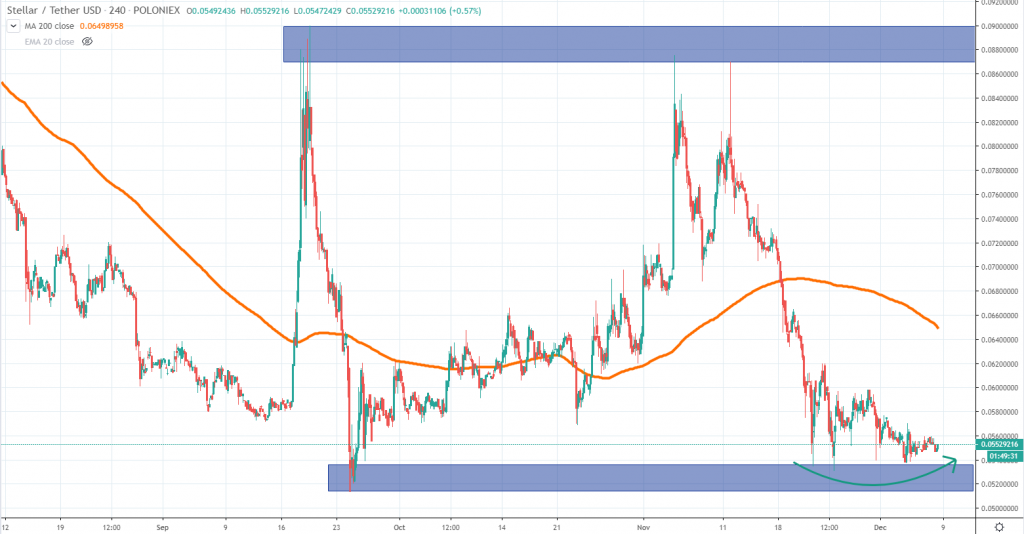
We’ve talked about Stellar a week ago and mentioned back then a major range that continues to be in play. Since the end of November, the price had been slowly consolidating is a narrowing range in what seems to look like a pre-breakout condition.
The 5.1 cents – 5.3 cents area should be the major support to look at and we reaffirm that it represents the best buying zone for people wanting to get long Stellar. If the range will hold, the upside potential is great, given that the next leg up could propel the price towards the 9 cents area.
However, a major breakout below 5.1 cents will be the main negative scenario that could negate our current slightly positive view on Stellar. Let’s see how the price action will continue to unfold, but so far, things are encouraging for the buyers.
Briefings about ICOs
Viewo is a Hong Kong-based ICO that will continue to raise funds until December 11th. The company wants to develop a video sharing network operating on a blockchain-based rewards system.
On December 9th, Flas Exchange, a UK-based ICO, will start its presale for a comprehensive trading platform offering various types of digital assets, alongside a unique set of features for professional traders.





There are no comments at the moment, do you want to add one?
Write a comment