
BTCUSD (Coinbase)
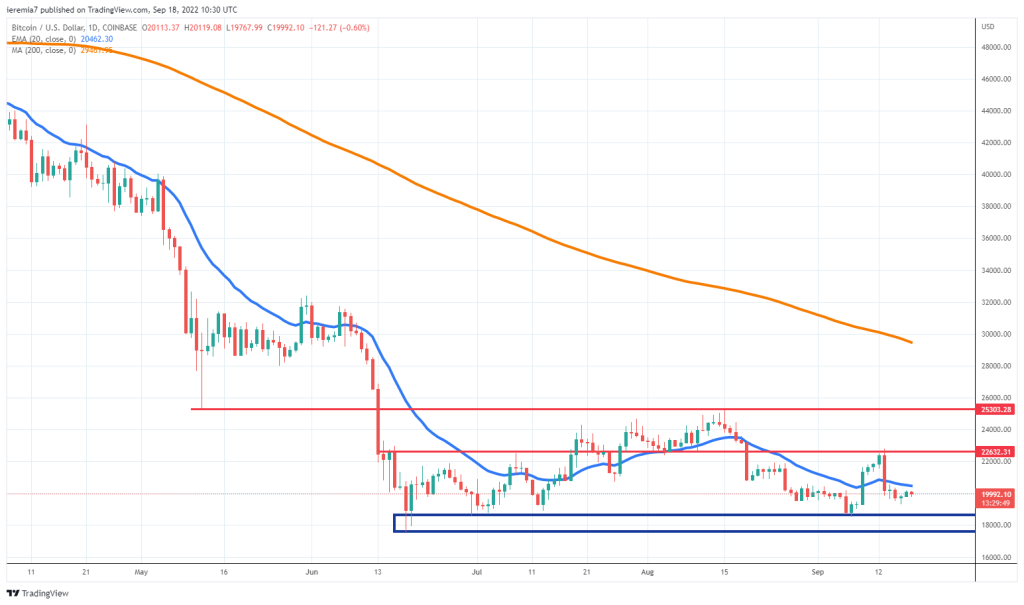
Despite an encouraging start of the week, Bitcoin is poised to end in red, mainly due to the losses that started to unwind once the US inflation figures were released. Investors and traders fear inflation is sticky and that could prompt more hawkishness from central banks, in particular the FED.
Bitcoin reversed strongly as can be seen on the daily chart, and now the price continues to trade below the 20 EMA. That means the key support area, highlighted in blue, must cap the downside. Else, a breakout below $17,500 could trigger more selling and $15,000 will become the next downside target.
On the other hand, if we see BTC starting to rebound and close above the 20 EMA, it could mean sellers are getting squeezed. In that scenario, $22,600 would become the first key resistance to overcome. If that will be the case, reaching $25,000 will then be a formality. We suspect the market will remain on edge, at least until the FED meeting. A relief rally could come only after Wednesday evening.
ETHUSD (Kraken)
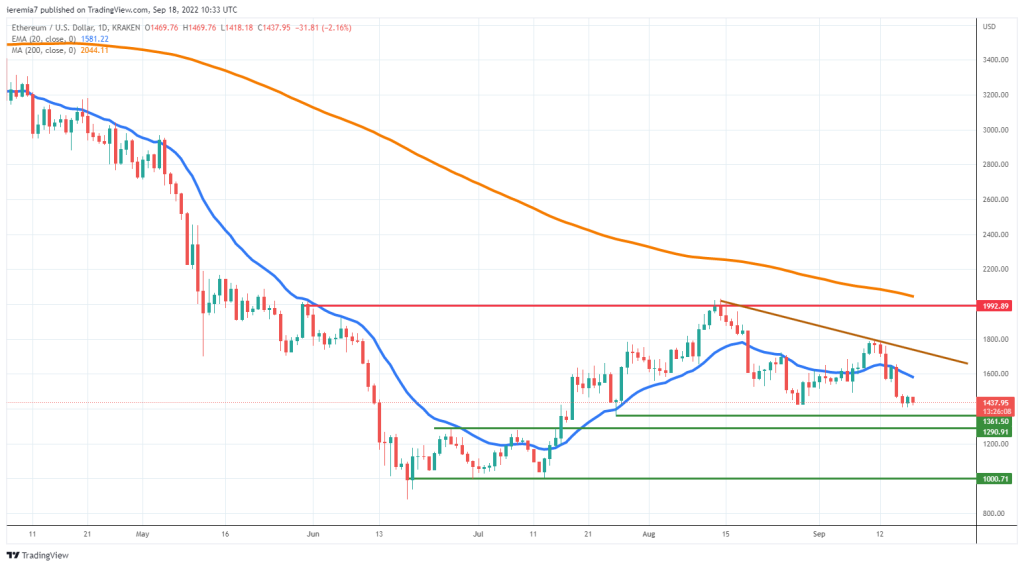
Although the Ethereum blockchain merge is now completed and the project runs only on Proof-of-Stake, that has not been enough to spur a price rally. This looks like a classic sell-the-news event, with implications on the technical picture as well.
Ether now threatens to break below $1,400 a level that held since the end of July. If $1,300 won’t manage to cap the downside, that’s bad news for the second-largest crypto, given it could revisit the $1,000 area.
Structurally, this token remains in a downtrend, until $2,000 will be broken on the upside. But until that happens, buyers could also struggle to overcome a short-term falling trend line. We don’t advise taking a long position right now, as the risk for a continuation lower is high at the start of the next week.
XRPUSD (Kraken)
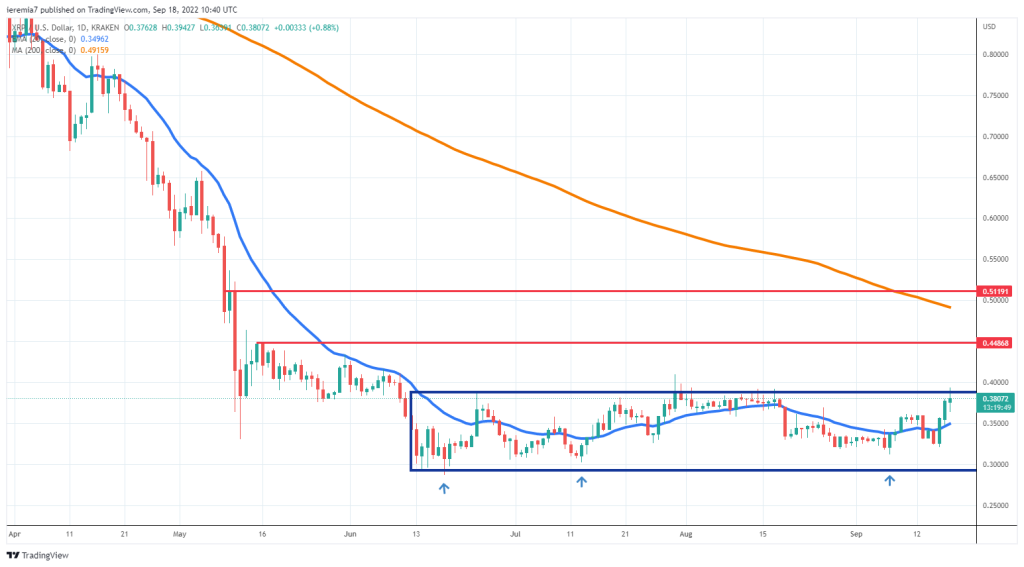
XRP had a muted performance since June when it started to trade inside a range between 30 and 38 cents. Even if the market recently retested the upper side of that structure, buyers were unable to breach above it. That signals there is still a sense of balance in the order flow and breakout traders will have to wait.
While the price still trades inside the range, a new leg lower should not be excluded. This makes 30 cents a potential downside target if sellers get more active. A daily close above 38 cents, on the other hand, will be positive news.
In that scenario, we expect XRP to edge higher, only to encounter resistance around 44 or 51 cents. The upside is slightly favored right now, given we can notice several higher lows. A higher high on the daily chart would be the confirmation of a change in the price action structure. However, this potential change will fail if the price breaks below 32 cents. We expect more volatility in the upcoming days, so there is no reason to take exposure from now.


There are no comments at the moment, do you want to add one?
Write a comment