
BTCUSD Coinbase
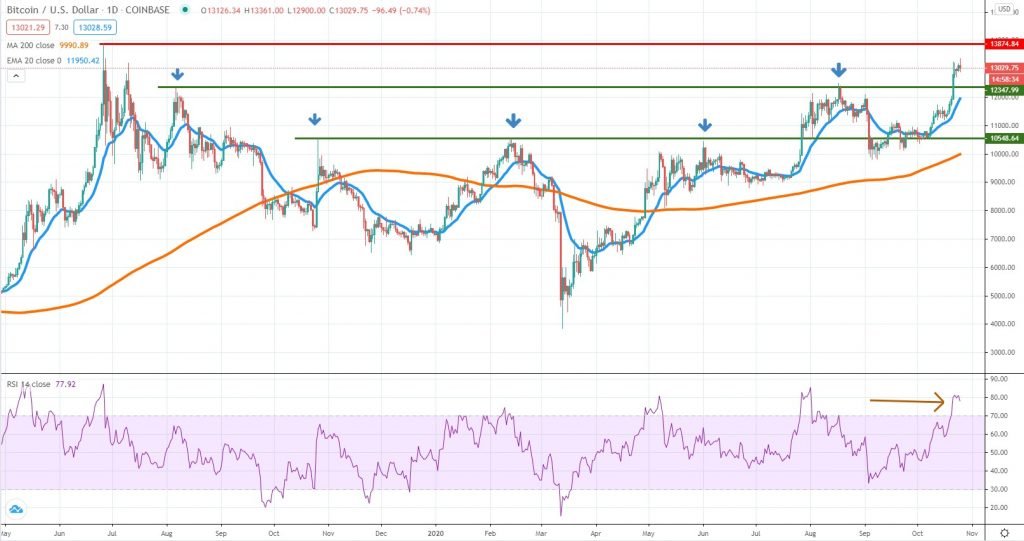
It was another positive week for Bitcoin considering the price broke above the August high and reached 13,300 for the first time since July 2019. This positive development had been triggered by the latest news from PayPal, which will allow, buying, selling, and Bitcoin storage for US customers.
Looking at the daily chart above, we can easily notice that the next key area to watch is around $13,874, which is where Bitcoin topped in June 2019. Only an impulsive breakout above it, followed by weak selling could propel the valuation even which, but buyers should take into account other factors as well.
Looking at the daily RSI, Bitcoin is now in overbought territory and as many times in the past, a correction followed. Buyers should wait for pullbacks towards $12,300 or the daily 20 EMA because that will provide more attractive valuations. At the same time, the risk sentiment could deteriorate at any point, due to COVID-19 or the US election.
ETHUSD Kraken
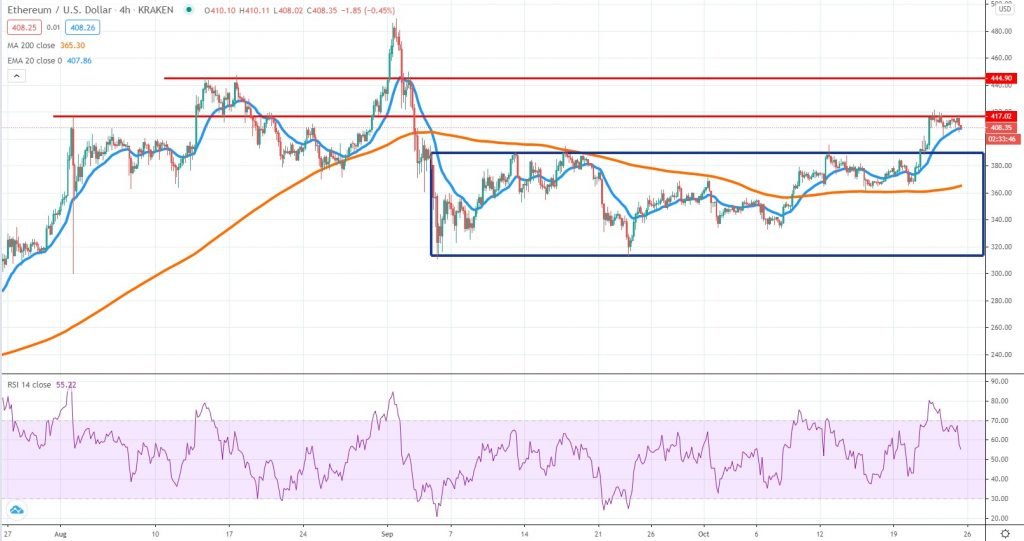
Ether continues to underperform Bitcoin and remains below the current 2020 highs. The price breached above the range we’ve talked about last week and found resistance right around our first target – $417. The RSI was overbought and a corrective move was very likely, with buyers now able to cap the downside around the 4h chart 20 EMA.
More weakness in the days ahead could mean Ether will retest the broken range. Breaking back inside the structure would be a negative development and could signal more losses until the 4h chart 200 SMA.
If buyers will rejoin around $390, then we could Ether starting a new leg up. Traders should be cautious because weakness in Bitcoin could trigger impulsive selling in ETH, given its underperformance.
We continue to believe that it would be very difficult for the price to manage to break and continue above $444 in the near term, given all the market uncertainties.
STRUSDT Poloniex
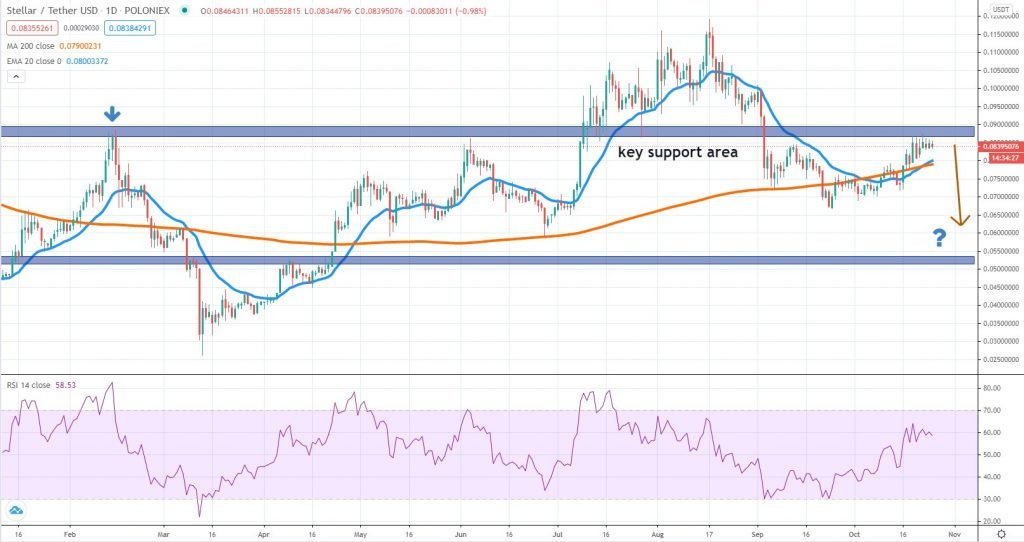
Although it managed to recover since the end of September, Stellar is another underperformer that could drop impulsively in case the broad market sentiment deteriorates. The price is already showing signs of weakness after touching the 8.5 cents area, a key zone which we’ve talked about in other previous articles.
It is not enough to see Stellar below that zone but to confirm increased selling interest, the price should break below both the daily 20 EMA and 200 SMA. Only then the sellers will be fully in control and more downside will follow, very likely towards the 5 cents area, where the bottom of the range is located.
The least-likely scenario, for now, is to see a breakout and continuation above 8.5 cents. If that would be the case, expect Stellar to edge towards the August highs in the mid-term. However, buyers had a hard time recovering some of the losses and their job would be even more difficult to drive towards new 2020 highs. Momentum is weak and that gives sellers a slight advantage at the time of writing.


There are no comments at the moment, do you want to add one?
Write a comment