
BTCUSD Bitstamp
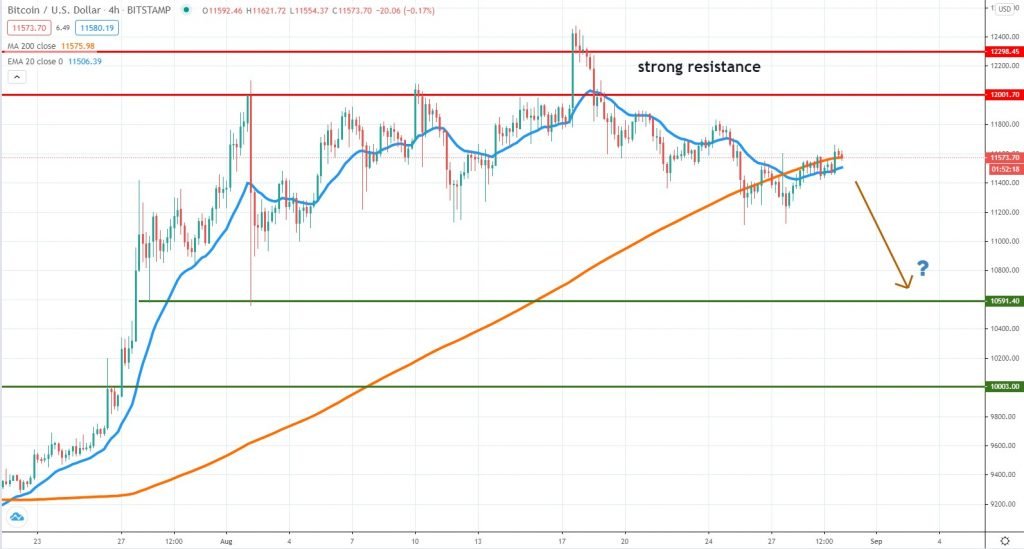
In our last weekly crypto analysis, we’ve highlighted that if Bitcoin continues to trade below the 4h chart 20 EMA, that would be a negative sign and the downturn could persist. That’s exactly what happened, and we currently see the price still in the corrective phase. The activity is quite choppy and this isn’t the right time to take long-term positions.
However, the changing structure is favorable for the sellers and sustained weakness could open more room to the downside, probably towards the key $10,500 support area. That’s when the August 2nd selloff stopped and buyers could step in once again. Not even the 4h chart 200 MA was able to act as solid support and we believe sellers have a slight advantage.
In case the price will rise above the 200 MA, that could be an encouraging sign for buyers and will expose the $12,000 key resistance again. Only a surge above the August 17th high will suggest the bullish trend is set to continue.
ETHUSD Kraken
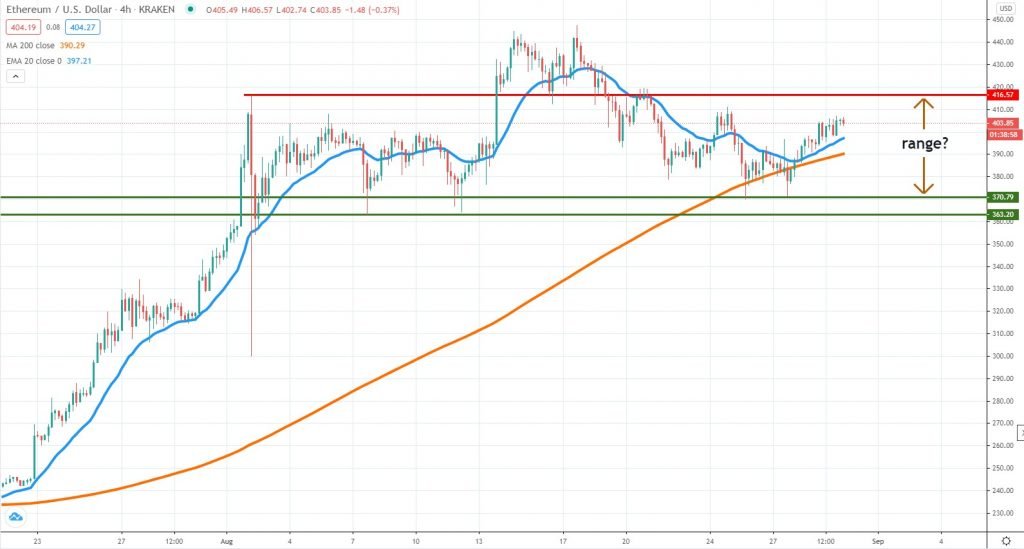
Things had been better for Ether, which had reacted twice after reaching the key $370 support. At the same time, the price is trending above the 4h chart 200 MA and the 20 EMA, a slight advantage over Bitcoin. With that being the case, we suspect there’s some more upside ahead, with the $416 level as the near-term resistance.
It looks like Ether is trading inside a range between $416 and $370, so until the structure breaks on either side, traders can respect it. Above $416, the next level to watch is $445 or where the price topped on August 17th. A continuation above it will be a good bullish signal.
However, in the case of Ether drops below the 200 MA, it could suggest the bottom of the range will be under pressure. More downside will be exposed in case sellers will actively drive the price below the range. For now, the consolidation happens after an impulsive run higher, so that is raising the odds for a continuation in the direction of the previous impulsive move (bullish).
STRUSDT Poloniex
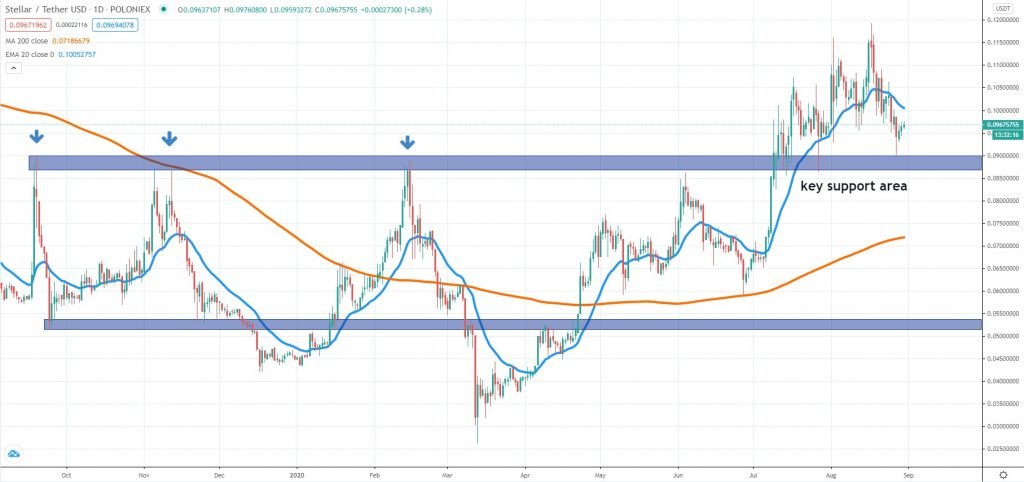
Stellar had been another well-performing altcoin for the past several months and it even managed to break above 8.6 – 9 cents key area that we’ve mentioned in prior weekly analysis articles. Since the buyers were strong enough to pierce higher, now that a retracement towards the broken area is unfolding, we should see strong support.
As a result, we believe that as long as Stellar won’t break back inside the structure highlighted in the chart, it would represent a great opportunity to get long at an attractive valuation.
In case stronger selling will drive the price below the key support area and buyers will have a limited reaction, that will signal a false break setup and more potential selling in the next several weeks/months. Viewed from a longer-term perspective, the performance we’ve seen this year might be indicative of a bottoming formation, a long-term bullish sign for Stellar.


There are no comments at the moment, do you want to add one?
Write a comment