
BTCUSD Coinbase
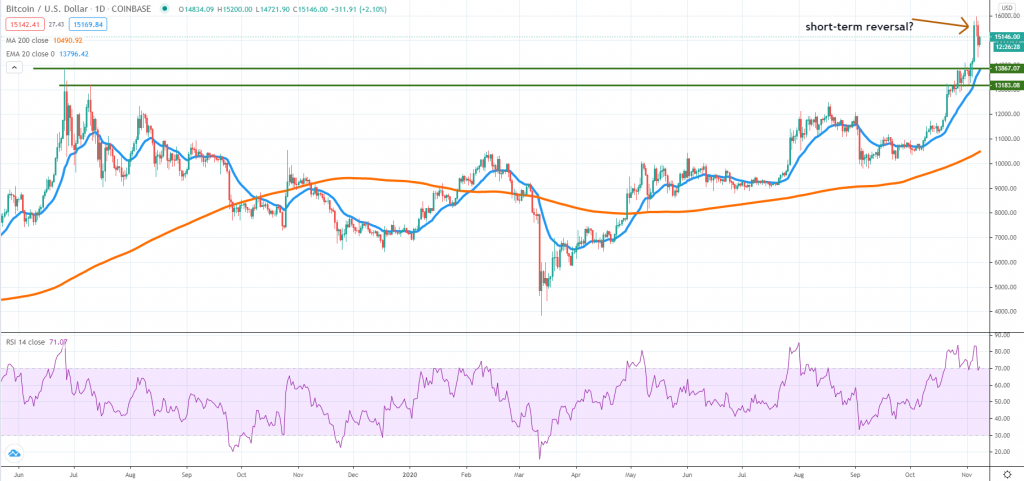
Even though more than a week ago we’ve seen Bitcoin struggling around the 2019 high, that wasn’t a problem for the buyers as they’ve squeezed the price past that critical resistance zone. Bitcoin is now trading at levels not seen since January 2018 and because of that, the bullish momentum remains elevated.
However, despite the impressive breakout on the upside, below the $13,860 – $13,200 area could be retested in the next few days, and only if buyers resume impulsively, should we expect a much larger continuation higher.
The RSI in the overbought zone and a short-term reversal price action formation on the daily chart are not encouraging for a continuation higher. It would be important to watch whether BTC can move past $16,000 or $16,500 without weakness emerging because that will indicate if the rally could extend even further.
It is time to treat the market with caution because the majority of market participants are “risk-on” right now. A break below the above-mentioned support area will be a key indicator for a false breakout and could suggest a corrective structure might be unfolding.
ETHUSD Kraken
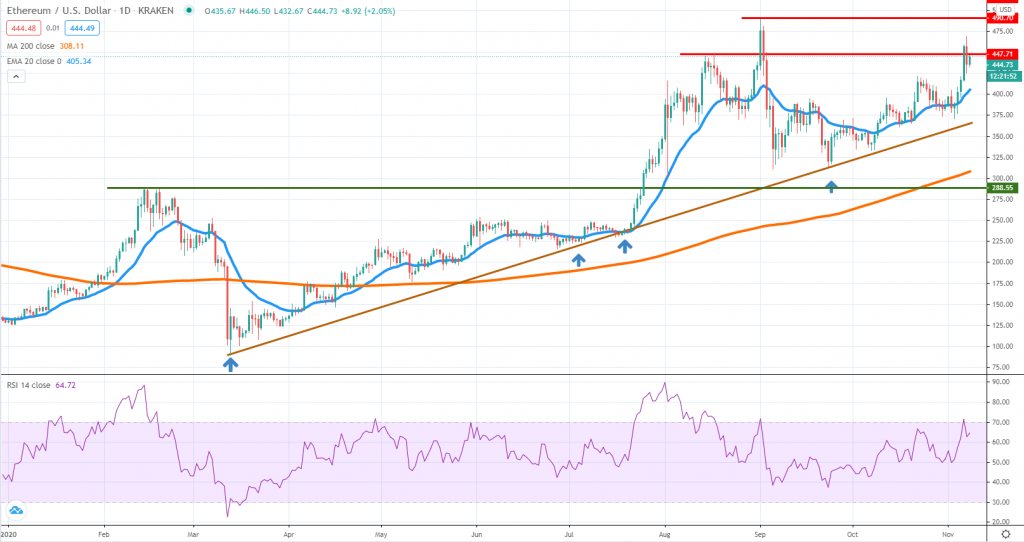
After being an underperformer in September and October, Ether had been picking up steam over the past few days, managing to break above $400. As we’ve mentioned in one of our past analysis, the $447 is proving to be a strong resistance, which is confirmed by the failure of ETH to remain above it.
As we move into the next week, it will be important to watch if buyers can push the price past yesterday’s high. If that will be the case, we expect the September highs to be revisited and that’s where selling interest could start to rise again.
On the other hand, ETH weakness will suggest the price can retrace towards the daily 20 EMA or the 200 SMA, with a trend line going back to March, following as the critical support area. That trend line held nicely several times and buyers might be interested to rejoin in case the price goes down.
BNBUSD Binance
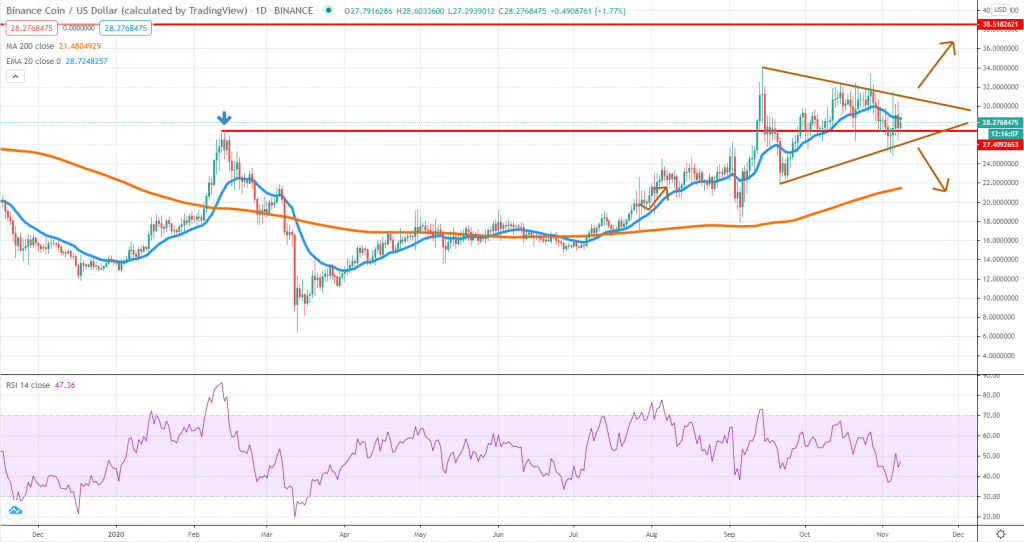
Binance Coin managed to break above the February highs since mid-September but although that was a major bullish development, buyers were unable to keep pushing the price higher. Over the past few weeks, a triangle type formation had shaped and now we are waiting for the direction of the break to get more insight into where the token is headed.
Breaking above the triangle will see the buyers as clear winners and we suspect BNB can continue upward towards the $38.5 resistance zone. On the other hand, failure to keep the price action above the February high, combined with a breakout below the triangle can send the token price towards the daily 200 SMA.
In the long run, breaking above $27.5 is very important, but we should not exclude a deeper pullback before buyers will have enough incentives to resume and push BNB towards new 2020 highs.


There are no comments at the moment, do you want to add one?
Write a comment