
BTCUSD (Coinbase)
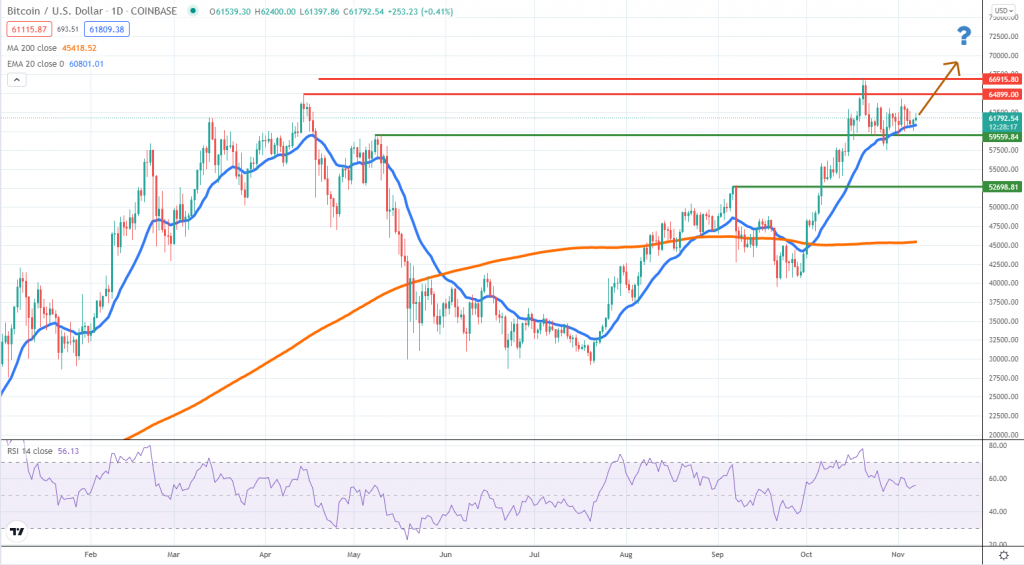
Source: TradingView
It’s been a quiet week for Bitcoin as buyers have calmed down following a brief break above the April 14th all-time high. The fact that the price did not manage to keep above that line is a short-term sign of weakening momentum and should keep buyers on their toes for a little longer.
Although the price is thus far managing to keep up above the daily 20 EMA, buying is weakening which leads us to believe that a deeper correction might be needed to incentivize buyers strong enough. With that being the case, a break below the EMA could mean BTC might extend lower and a first major target is around $52.7k, a swing high from September.
The only hope for bulls is if the price picks up steam again and breaks to a new all-time high. That will unlock the $70, 000 and revive optimism BTC can get closer to $100,000 by year-end. Based on current conditions, however, bears seem to be getting more power, raising the prospects for a correction.
ETHUSD (Kraken)
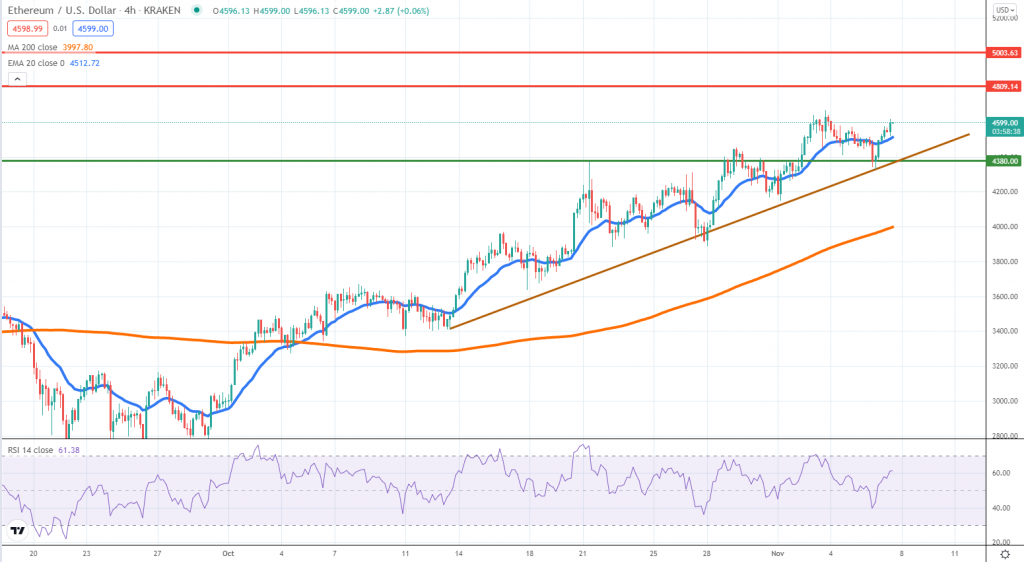
Source: TradingView
Ether finally broke above the prior all-time high and is has been treating it as support, sign buyers are willing to step in even at these elevated levels. The price was consistently edging up since September and pullbacks have been contained by the 4h chart 20 EMA, as well as an ascending trend line highlighted on our chart.
Managing to trade above $4.4k and the trend line will confirm ETH still has room to go. In that scenario, we expect the token to continue towards $4.8k and even $5k within the next couple of months. The “Santa Claus rally” might provide one final strong push for the crypto market before the year ends, but still, a great deal of caution is required at these elevated levels.
ETH weakening below $4.4k will be an early sign of bearishness and coupled with a breakout below the trend line, it would be the trigger for a continuation towards the $4k area, where the 200 SMA is also currently located. The RSI is not overbought or oversold, which leaves any scenario open.
DOTUSD (Kraken)
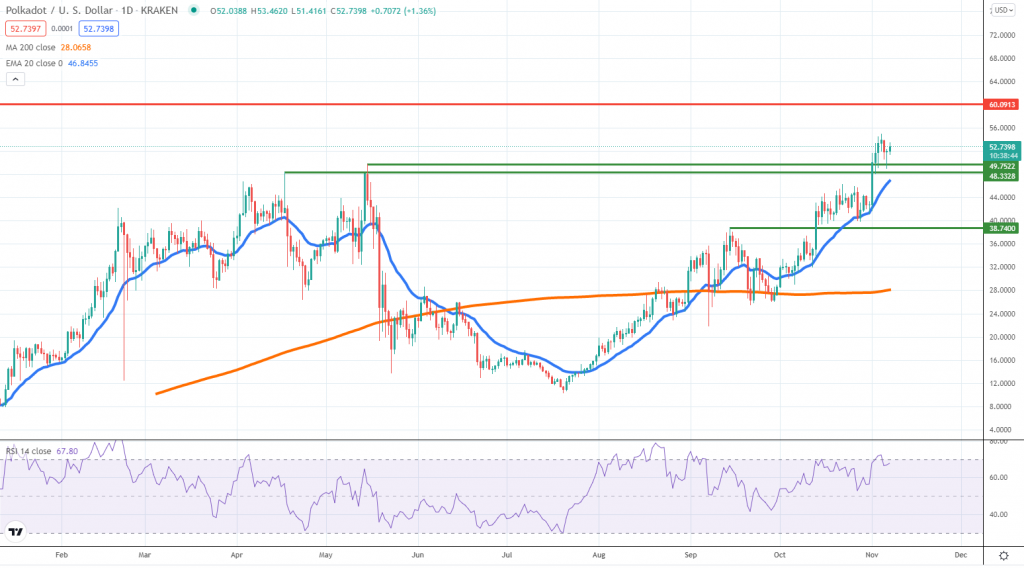
Source: TradingView
During the past week, Polkadot also managed to break to a new all-time high and that seems to be a strong reason for buyers to keep bidding up the price. DOT is now trading above the psychological area of $50 and more upside towards $60 has been unlocked.
The breakout and pullback setup is suggesting more gains might follow over the upcoming days, as long as the broad sentiment won’t deteriorate. This is a major technical break and even though a setup should not be completely ruled out, Polkadot can continue to move higher, as the DeFi sector still attracts wide interest.
On the negative side, the price needs to break below $50 and the daily 20 EMA and only in that case, sellers could drive it lower towards $40. The RSI is approaching overbought conditions and then it would be possible to see whether sentiment weakens or overshoot will occur.


There are no comments at the moment, do you want to add one?
Write a comment