
BTCUSD (Coinbase)
Source: TradingView
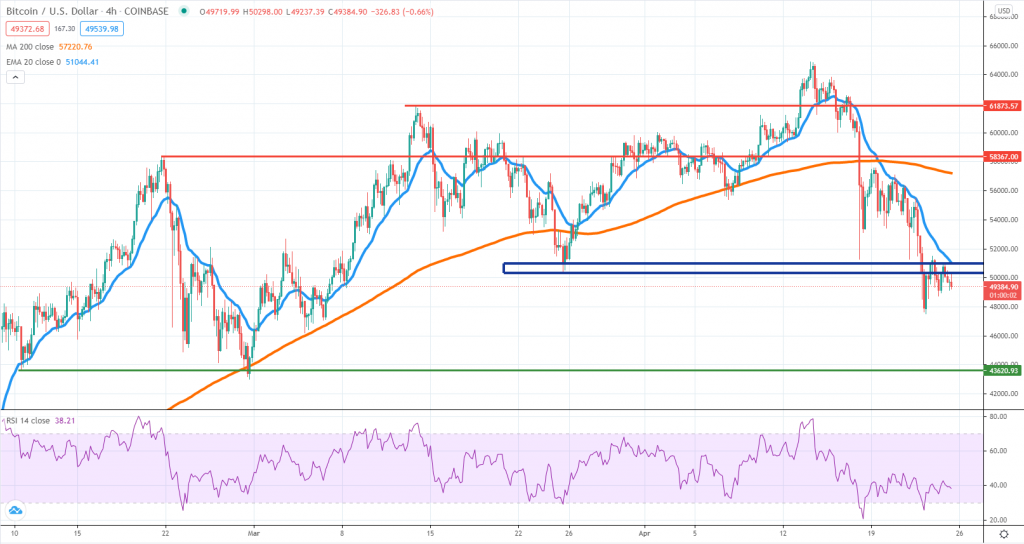
As we’ve anticipated in our last weekly crypto analysis, Bitcoin continued to weaken due to deteriorating risk sentiment and overbought conditions on higher time frames. Looking at the 4h chart, the $50,000 area had recently acted as resistance, given the price action failed to break back above it, after reaching a new weekly low around $47,500.
There’s no clue for strong buying for now, which is why we suspect there could be more pain during the next few days. The next key support area to watch is located around $43,600, where two prior strong bounces can be spotted in February this year.
Sellers looking to join the move lower should be waiting for a pullback towards the 20 EMA, given it had capped the upside since April 17th. The RSI remains depressed below the 50 area, suggesting there is little buying appetite. Only if buyers push the price above the 20 EMA should we expect some more gains.
ETHUSD (Kraken)
Source: TradingView
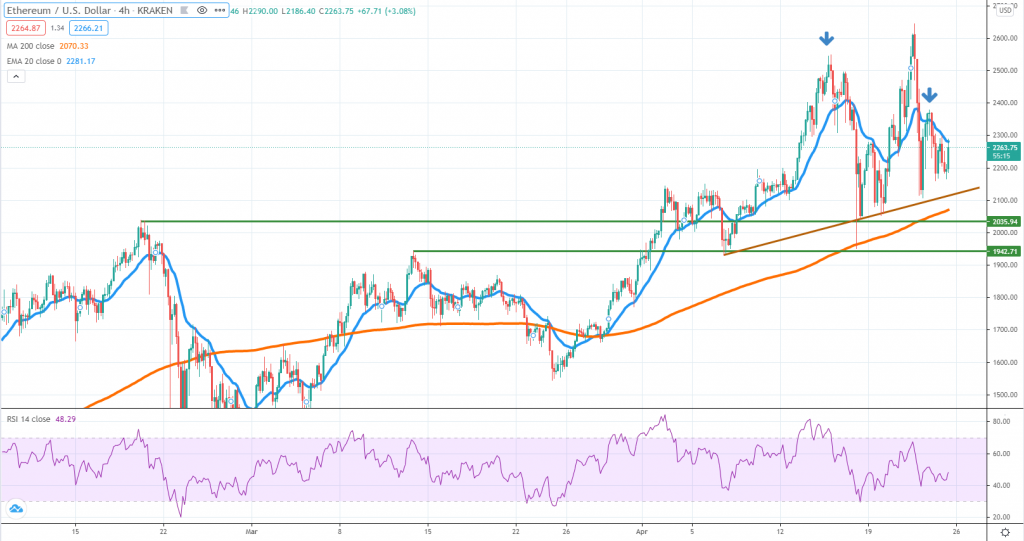
Even though it had also been under pressure during the past week, Ether did not break below any key support area as Bitcoin did. In this case, the area to watch is formed around the 4h chart 200 SMA and the $2,000 psychological barrier. If sellers will be able to push the price below it, there could be more pain ahead for ETH during the next several weeks.
In the meantime, a short-term ascending trendline seems to be capping the downside successfully, and only if it breaks, should the market’s attention shift towards the 4h chart 200 SMA. The chart is posting two impulsive waves of selling and even though buyers managed to prevent a further slump, it does not bode well for the near-term market sentiment.
On pullbacks to the upside, traders should watch if $2,300 will be treated as resistance again. Breaking above could unlock more potential towards $2,400 or even $2,500.
BNBUSD (Binance)
Source: TradingView
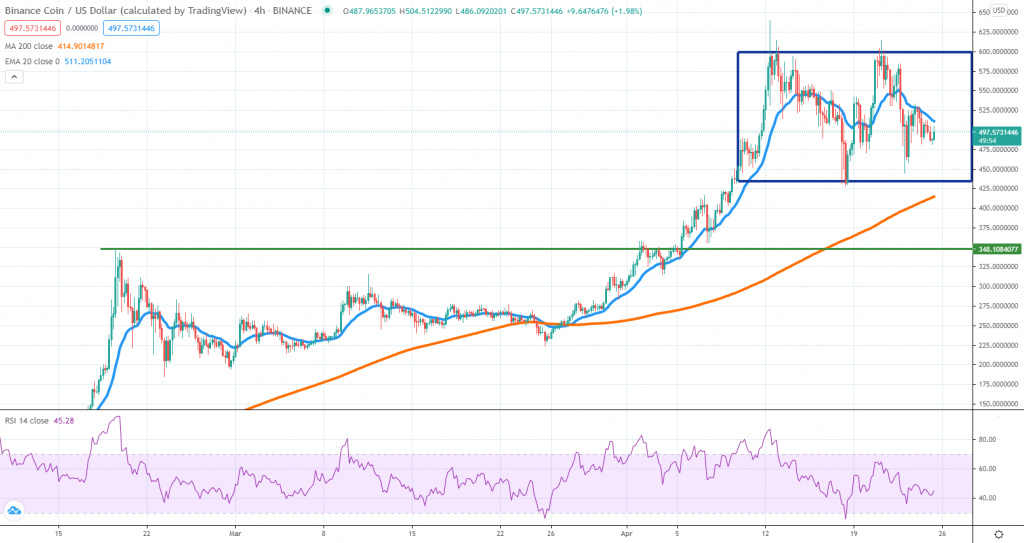
Due to deteriorating market sentiment, Binance Coin was unable to continue pushing higher and found resistance around the key $600 area. The price action looks locked inside a range between $600 and $430, which means traders can play both sides of the market until a breakout will occur.
This is one of the best performing tokens for the year, as the massive bull run in crypto was a major tailwind for Binance. However, if cryptocurrencies will continue to weaken, we suspect BNB will suffer and more gains will be wiped out.
The next important thing to watch is whether sellers will be able to break below the lower bound of the range. If that will be the case, traders should look at the 4h chart 200 SMA and the $350 role reversal level, which is also a prior all-time high for BNB.
Although the price is now in a tricky position, trading in the middle of the range, more clarity should be provided once the new week starts and liquidity gets back to normal. We think BNB will retest the lower line of the range and buyers will have the difficult task of defending it.


There are no comments at the moment, do you want to add one?
Write a comment