
BTCUSD (Coinbase chart)
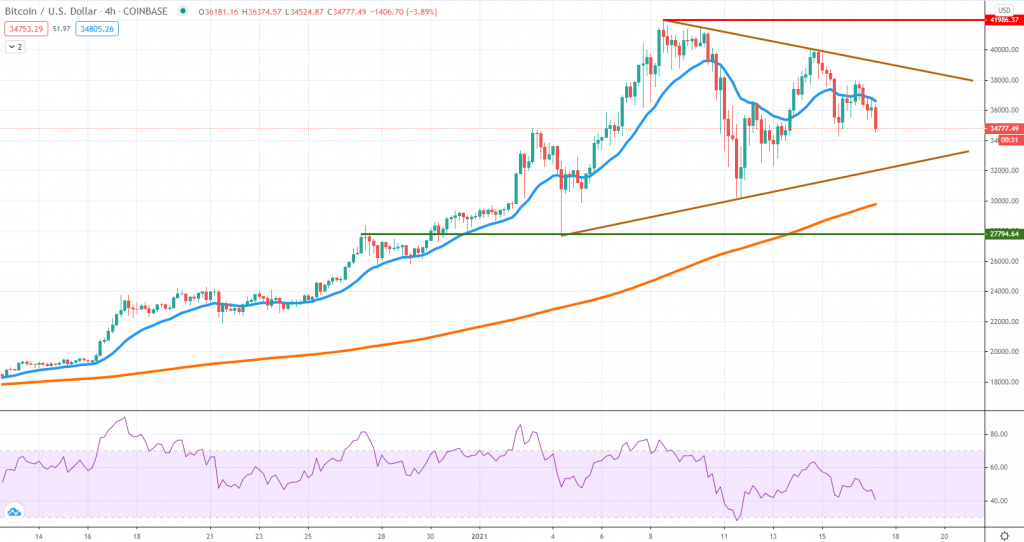
In line with our warnings last week, Bitcoin dropped more than 20%, finding support around the $30,000 area. Even though there wasn’t follow-through selling and the buyers managed to erase some of the losses, a new all-time had not been reached and in fact, we see the token under pressure as the week in drawing to a close.
Bitcoin is now trading inside a triangular corrective structure, which means the direction of the breakout, if it occurs, will determine who will be in control over the order flow. At the time of writing, the price is headed south and the next support area is located around $32,000. A break below will expose $30,000 and even $27,700 if selling picks up steam.
On the upside, buyers will need to clear the resistance zone around $38,000 to show they’re back on their game in full force. The US dollar had been gaining momentum for a few days in a row that’s currently one of the reasons pressuring Bitcoin.
ETHUSD (Kraken chart)
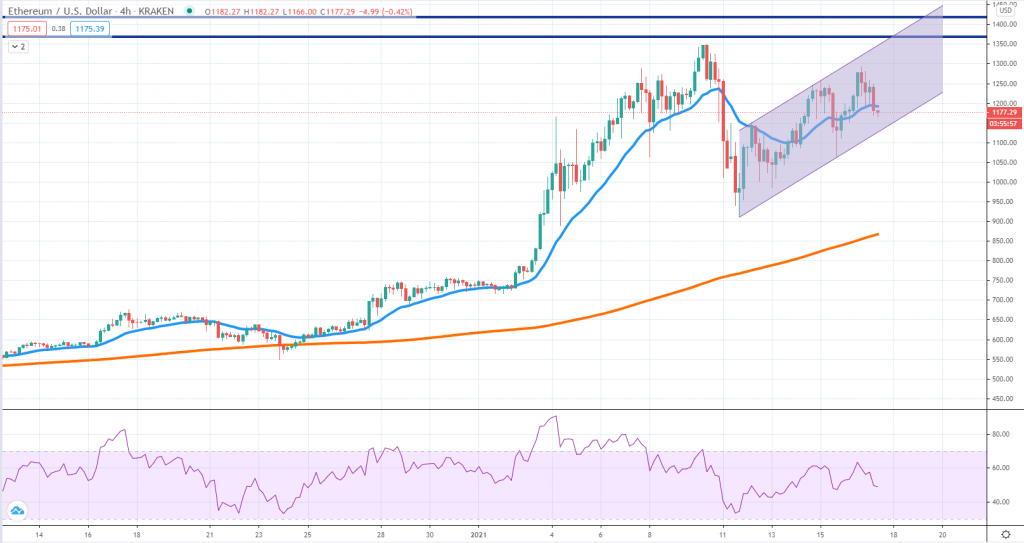
Even though ETH lost around $400 of value during the first two days of the past week, the recovery seems to be more robust, as compared to Bitcoin. The price is trading inside an ascending channel that so far has been respected by both sides of the market.
Since the sellers are now driving the price lower, it will be necessary to see if a break below the channel occurs. In that case, we suspect there will be room for more selling, with support located around $950, where the selloff was capped.
On the upside, the key resistance area around $1,400 remains in play, given the market had not managed to touch it before starting to retrace lower. The bigger picture suggests, the selloff was an impulsive move and the current retracement higher a correction, which increases the odds for an A-B-C type pattern.
LTCUSD (Coinbase chart)
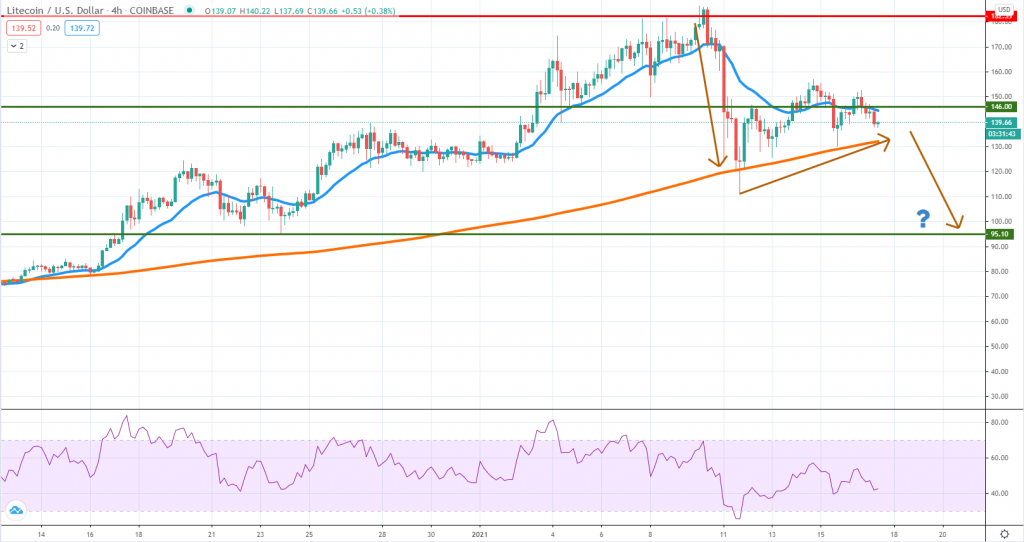
Litecoin is assumed to be a cryptocurrency reflecting the underlying momentum of the broad market. Based on the current price action structure, things are not looking good, since the buyers are posting a weak reaction to the selloff. For now, the price continues to trade above the 4h chart 200 SMA, but it is vulnerable to a breakout lower.
This is the most likely scenario moving into next week and we suspect there will be increased pressure on the moving average. If sellers prevail, then it is possible to see the token weakening towards the $95 support area. Another reason why our bias shifted to the bearish side has to do with the market’s reaction around $146.
The bullish case scenario will first imply a break above the $150 area and continuation higher. Even if that will occur, the market is ranging until a breakout above January 10th occurs. A short-squeeze shouldn’t be ruled out, especially if we consider how unpredictable the crypto market had been for the past several months. We advise our readers to stick with a short-term bearish view until the market will point in the other direction.


There are no comments at the moment, do you want to add one?
Write a comment