
BTCUSD Coinbase
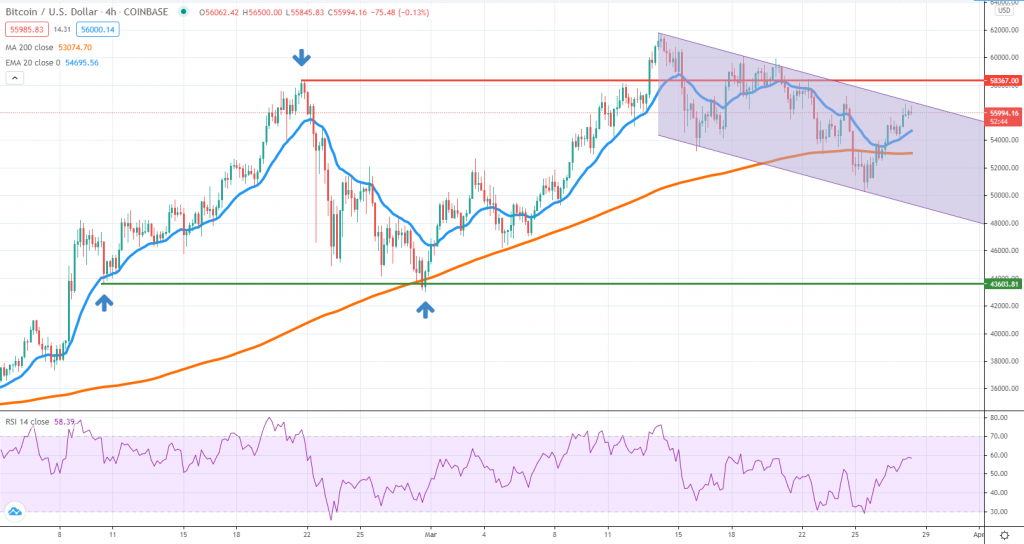
Over the past week, the sellers had been in control as the BTC price failed to break above the former February all-time high located around $58,300. Now the price is moving lower inside a downside channel that so far had been respected by the market accurately.
As long as the structure remains in play, we suspect there could be more downside ahead for Bitcoin, as persistent trading below the 4h chart 200 SMA will open more room towards the lower bound of the range mentioned a week ago.
If buyers do break above the channel, the upside until the $58,300 area is very limited and they will need to face hurdles there as well. At this point, only if the price breaks to new all-time highs, should we expect an increased probability for a bullish continuation higher. We advise long-term buyers to remain cautious, even if gains start to unfold, because conditions on higher time frames are very extreme, making a sharper BTC correction increasingly likely over the upcoming weeks.
ETHUSD Kraken
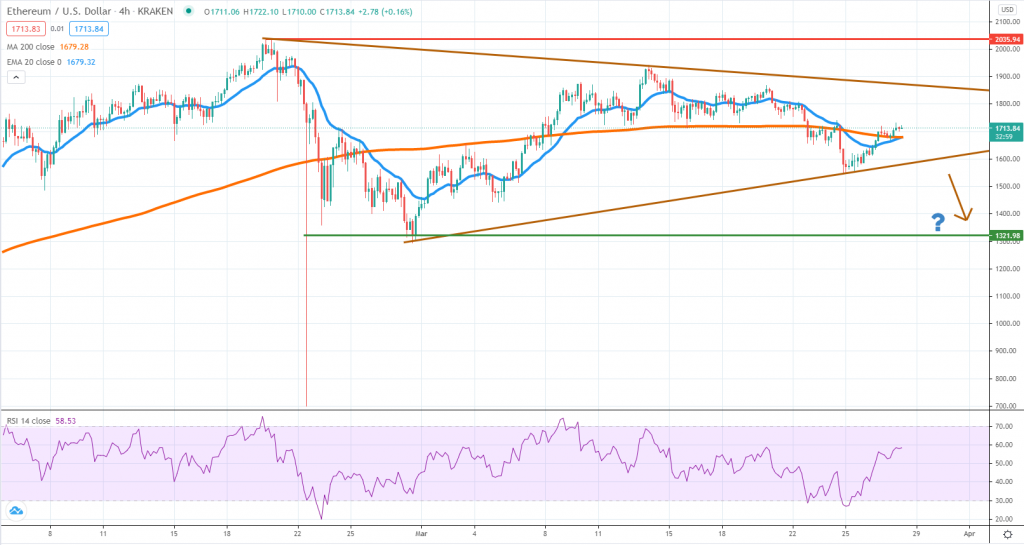
Ether volatility continues to compress, as the price is now trading inside a triangle formation. Even though the structure still has room to fill, placing trades now that the price is in the middle of the triangle wouldn’t be appropriate from a risk/reward perspective.
During the past week, the price breached below the 4h chart 200 SMA but found support around $1,550. Now it’s trading back above the SMA, which means the short-term bias shifted in favor of the bulls.
It will be important to watch whether sellers will rejoin impulsively around $1,850, where the upper line of the triangle is located. If that will be the case, we suspect the price will not only head lower but also very likely breach the structure on the downside.
The bigger picture might be suggesting a longer topping formation that should bring with it more downside risks. As with Bitcoin, extreme overbought conditions on higher time frames are not supporting more heavy gains on the upside.
STRUSDT Poloniex
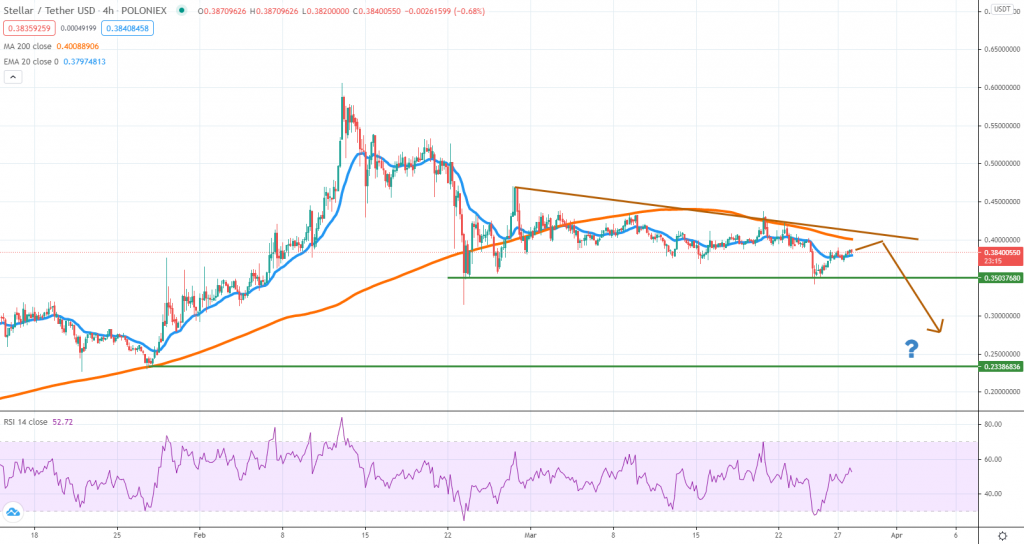
Stellar is one of the top altcoins that’s under pressure, given we can easily notice a pre-breakout formation, suggesting buyers are being squeezed towards the 35 cents key support area. If the pressure will continue to mount on that zone, a continuation lower looks imminent.
Sellers wanting to get short should wait until the price reached the 4h chart 200 SMA or a downward trendline located a little above it. Failure to break on the upside will mean sellers still hold the upper hand and will also increase the probability for a breakout lower.
The bearish scenario materializing could send the price of Stellar lower towards the 23 cents key support area. We don’t expect any major counter-trend move until then. However, if the bullish sentiment will come on top, then it is very likely to see Stellar headed towards the 55 cents or even 60 cents resistance area, where the current 2021 high is located.


There are no comments at the moment, do you want to add one?
Write a comment