
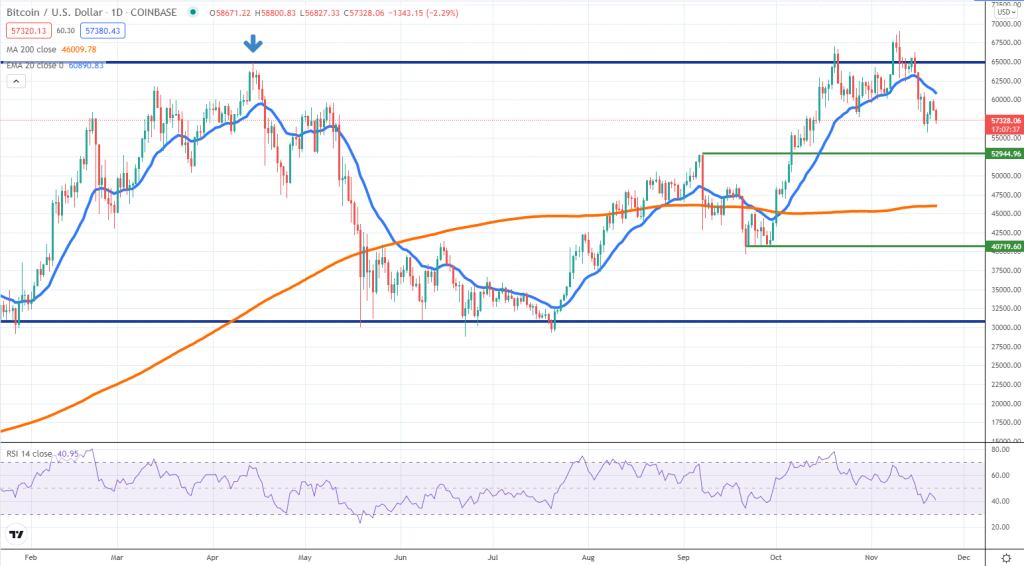
BTCUSD (Coinbase)
Source: TradingView
The Bitcoin price has been under pressure during the past week, moving away from the $65k area, a critical zone that would have confirmed a move higher, if buyers managed to keep the price above it. After two failed attempts, the sellers ended up on top and now we see the price weakening at a strong pace.
Because of that, we believe Bitcoin is trading inside a large range between $65k and $30k. Until either side is breached, the long-term direction remains uncertain. Inside this structure, $53k and $40k are areas to watch for buying interest.
News related to crypto regulation in the US and also, institutional buyers starting to sell have been pressuring Bitcoin and we suspect the weakness could continue this week. Keep in mind that the Dollar Index is trading close to its yearly high and that is not a favorable tailwind for BTC. The price also breached below the daily 20 EMA and the RSI is pointing south. These are not the conditions suggesting bullish momentum is dominating.
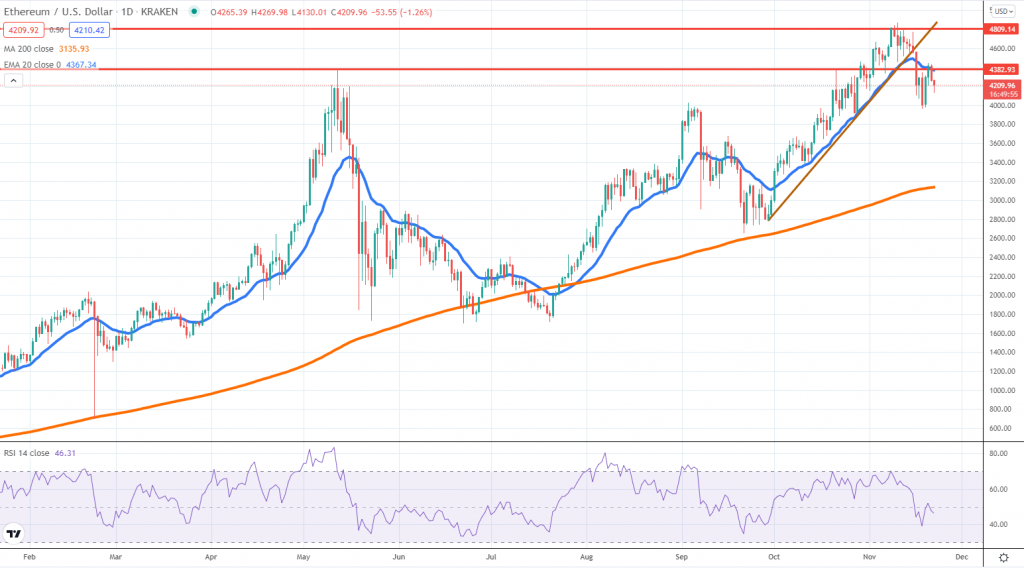
ETHUSD (Kraken)
Source: TradingView
Similar to what Bitcoin did, Ether had also weakened after touching the $4,800 area for the first time. The selling was strong enough to break below and retest the $4,400 area, a key role reversal level that failed to generate buying interest.
At the same time, the market now seems to be treating the daily 20 EMA as resistance and that could be an early indication for further selling down the road. The $4,000 area is a psychological zone to watch since the current weakness stalled around it.
However, if the selling accelerates below it, we could see ETH edging closer to the daily 200 SMA, currently located near the $3,200 area. All in all, the overall picture is deteriorating, showing the buying appetite is weakening. Ether had quite a run, outperforming BTC, but as with any other bullish moves, sooner or later it has to end.
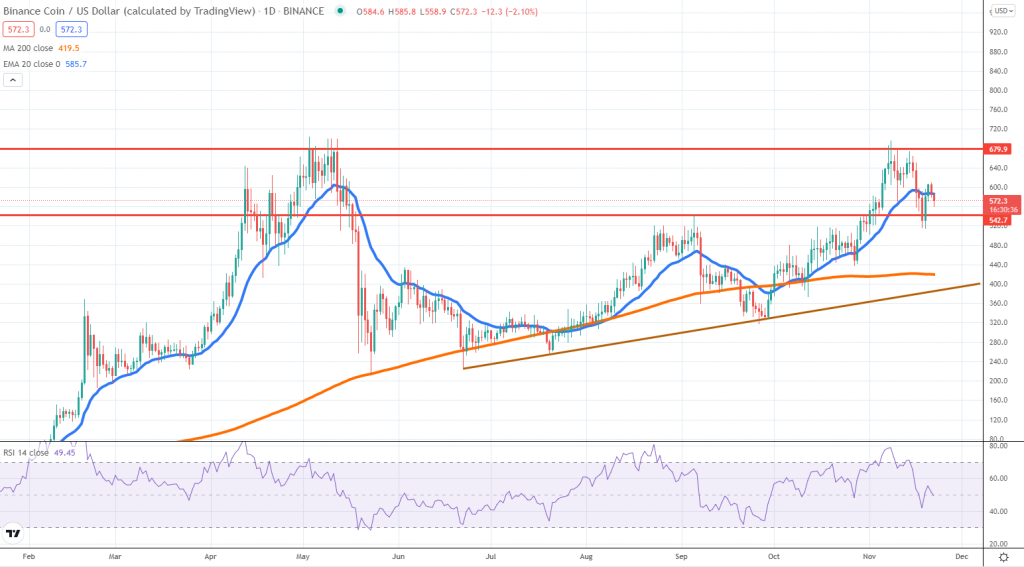
BNBUSD (Binance)
Source: TradingView
Another token vulnerable to form a double top formation is Binance Coin. The price encountered resistance around the $680 area and has been selling ever since. Although some buyers emerged at $540, the strength of the move seems to be fading and sellers are back pressuring the price lower.
If the selloff will extend below the 20 EMA on the daily chart, then it is very likely BNB will continue towards the $400 area. In that location, we can spot the daily 200 SMA and also an ascending trend line that held since June this year.
How BNB performs can be treated as a gauge of the broad market sentiment. When cryptocurrencies are going up, Binance is one of the leading exchanges benefiting from larger trading volumes. The interest in crypto drops alongside falling prices and thus the present weakness in BNB is not good news for buyers.
In the balance of probabilities, Binance Coin looks set to continue weakening in the short-term, unless the market finds a new strong reason to bid up prices.


There are no comments at the moment, do you want to add one?
Write a comment