BTCUSD (Bitstamp)
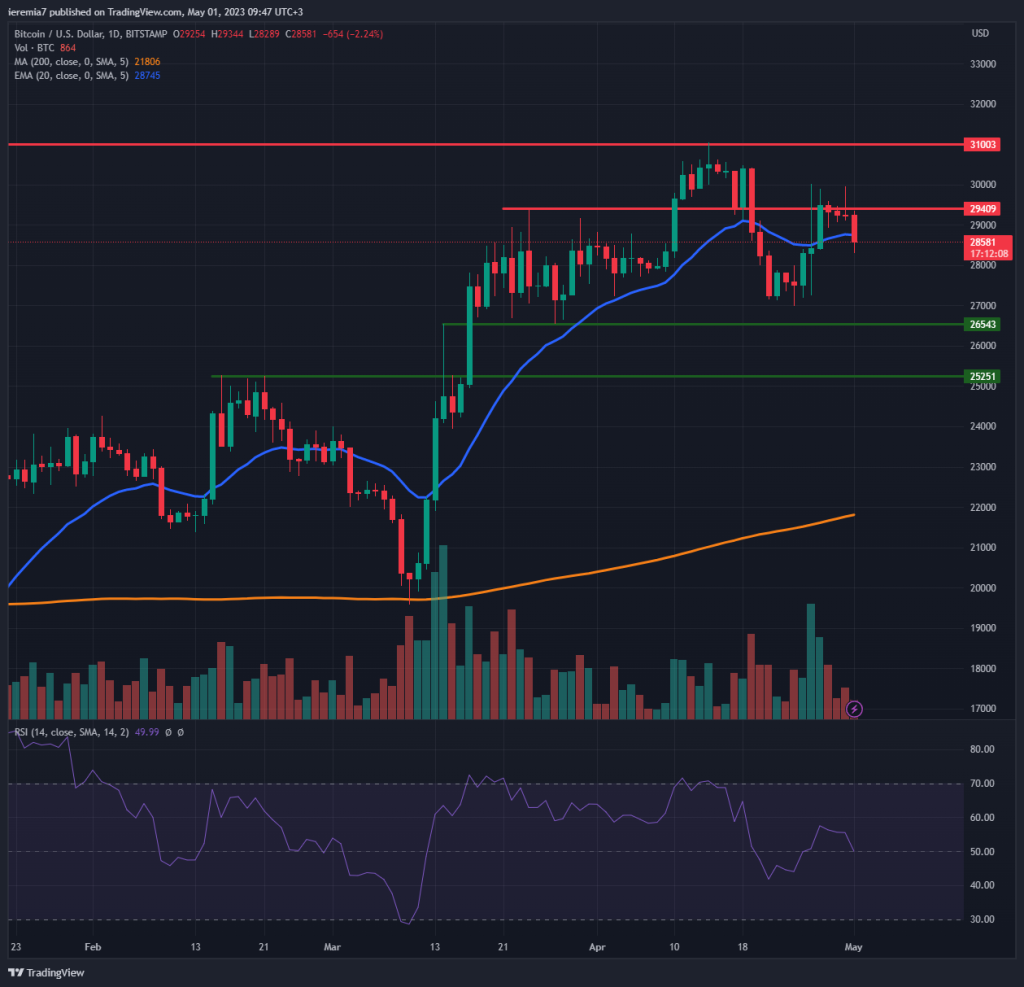
Bitcoin recovered during the first half of last week, but $30,000 turned out to be a very strong resistance. We are now seeing sellers pressuring the daily 20 EMA and that’s not an encouraging sign ahead of a new week packed with macro data.
From our point of view as long as the price is unable to close above the $29,500 – $30,000 area, the short-term sentiment is slightly bearish. Further losses from the current level would mean the next areas to watch are $26,500 and then $25,200. The start of the year exceeded expectations in terms of BTC price performance, so some profit-taking shouldn’t be a surprise.
If Bitcoin rotates back higher and breaks above $30,000, we need to watch whether $31,000 will be pierced as well. A new high for the year would show buyers are confident to buy even at higher levels, supporting the bull run even further. In that case, our mid-term upside target will shift toward $35,000. Risks to the downside should not be excluded, as we believe this is a highly unstable bullish price action.
ETHUSD (Kraken)
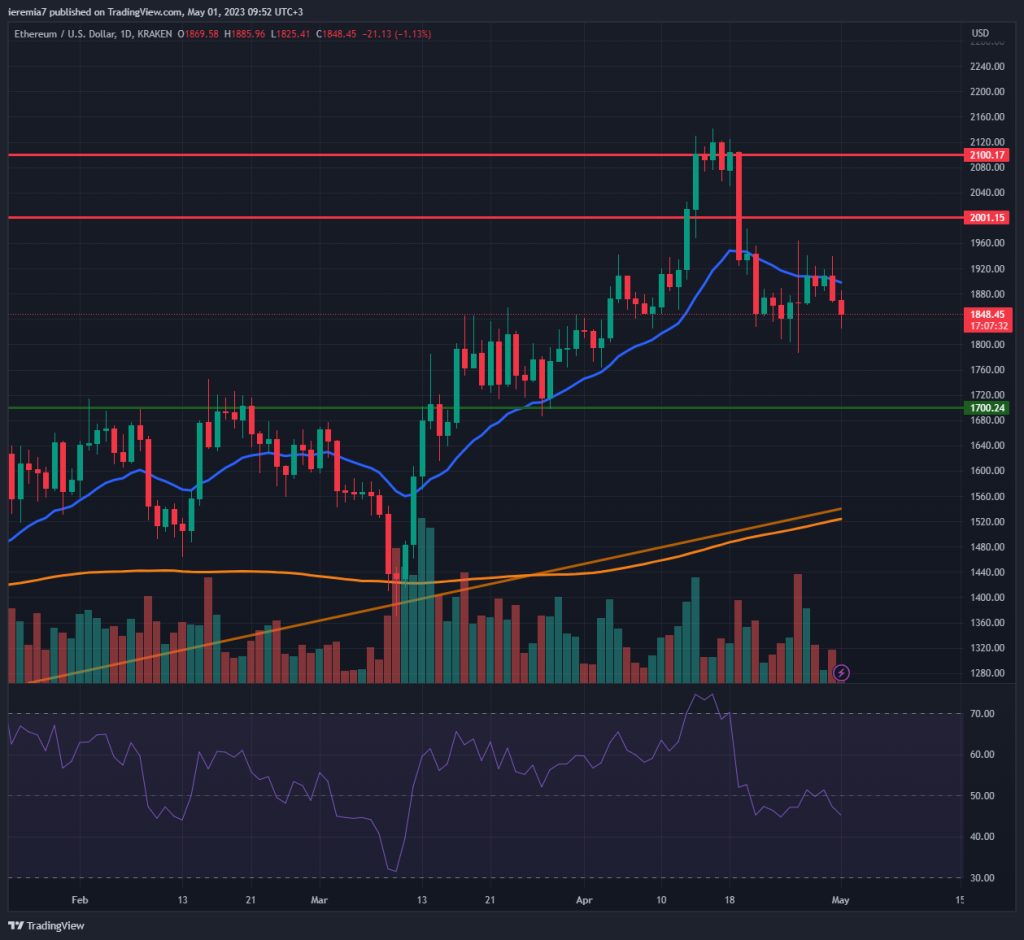
When looking at Ether, it seems to underperform Bitcoin considering the price rebound has been very weak last week. We might be seeing the beginning of a larger corrective move lower, considering the market is starting to treat the daily 20 EMA as resistance instead of support.
Technically, once the price rejected the $2k – $2.1k resistance area impulsively, buyers have been reluctant to rejoin the upside move, although valuations are cheaper. This isn’t a good sign as we enter a month during which all major risk assets tend to perform poorly (“sell in May and go away”).
There could be more downside ahead for ETH and we look at $1,700 as the next major support area. Failure to cap selling around it would mean the price could slump further toward $1,520. On the upside, we need to see a clear break and close above $2,000. That will show bullish confidence and from there, the market can extend even above $2,100.
ATOMUSD (Coinbase)
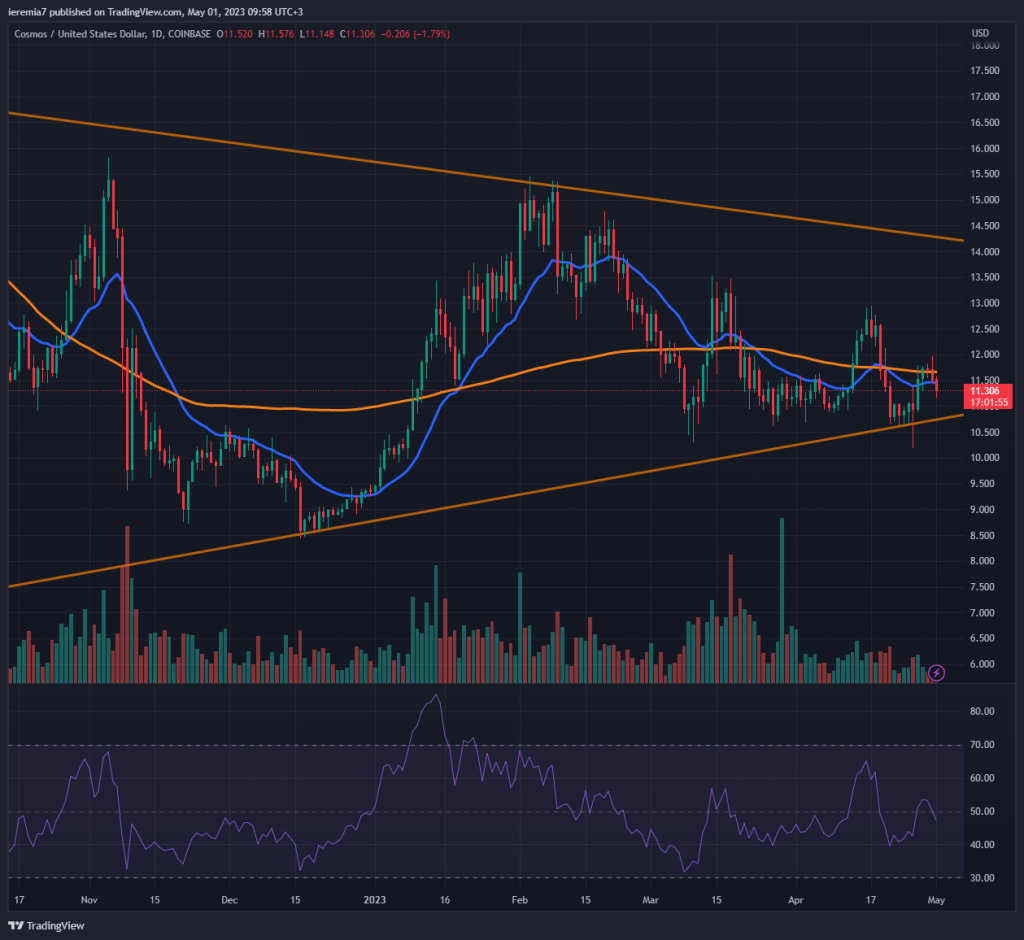
Cosmos is one of the cryptocurrencies that are posting +4% gains last week, but when looking at the charts, we can see volatility compression. The price is gradually filling a triangle pattern and we believe a more explosive move might happen during the next few weeks.
However, as long as the price respects the structure, traders should treat the lower line as support. Conversely, resistance kicks in around $14, where the upper line of the triangle is located. Alongside the triangle pattern, we are noticing subtle signs of weakness. The price doesn’t manage to break and hold above the daily 200 SMA and that’s a reason for concern.
At the same time, we don’t see follow-through selling once the ATOM breaks back below the 200 SMA, so you should wait and see until the market will reach an agreement. Broad sentiment can also play a role, meaning a break below the triangle could happen sooner than expected. Also, if the market continues to trade sideways, then ATOM should be able to consolidate or even move higher.


There are no comments at the moment, do you want to add one?
Write a comment