
BTCUSD (Bitstamp)
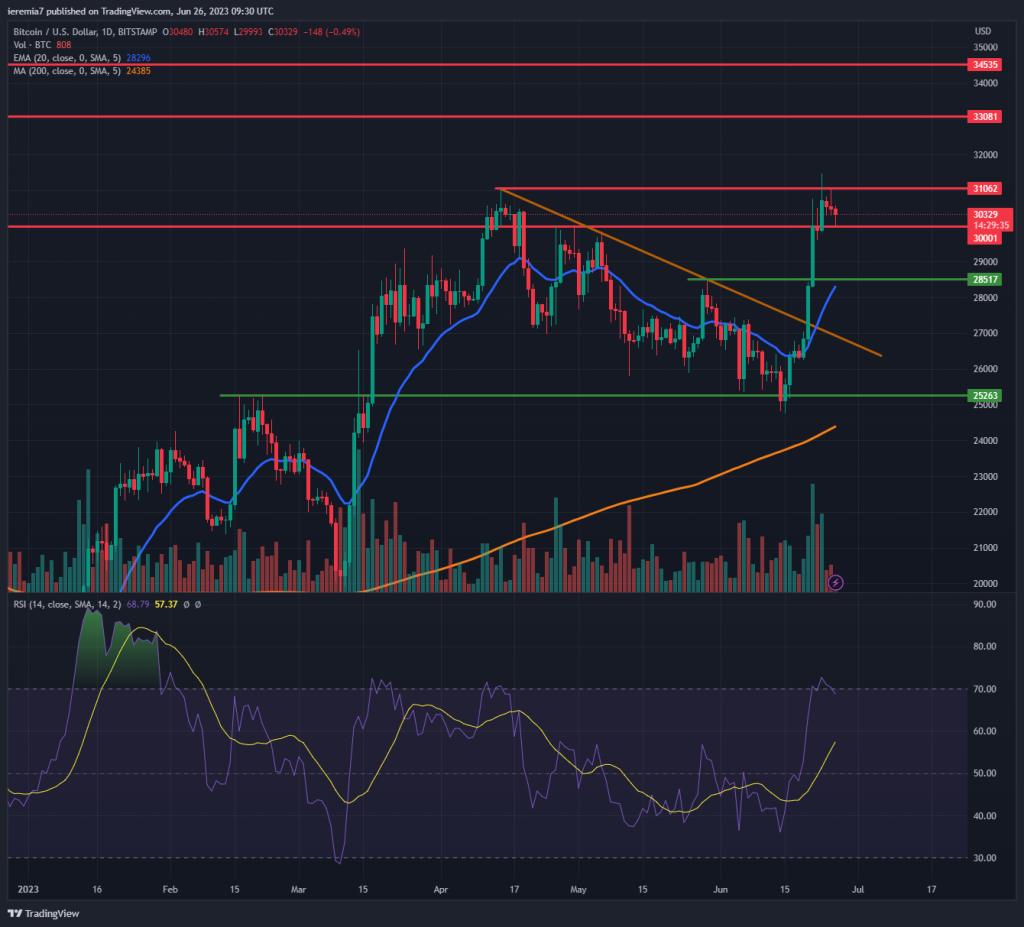
The market sentiment improved substantially since last week on the back of news related to the BlackRock Bitcoin ETF. That could mean new future inflows into BTC and market participants decided to front run. Technically, the price broke above the falling trend line we’ve talked about and naturally, $30,000 became the next major resistance.
Due to impulsive buying, Bitcoin managed to exceed it and even touched a new high for the year. However, we are now in consolidation mode and a break above $31,000 is necessary to stem new buyers. If that’s the case, our next upside targets are $33,000 and $34,500. Higher highs indicate buyers are in control of the order flow, so in such circumstances, it’s better to look after buying opportunities.
We should not ignore the potential for a pullback and the first signs of weakness will emerge if Bitcoin closes below $30,000 on a daily basis. If that’s the case, there’s scope for additional selling towards $28,500 and the daily 20 EMA. RSI also touched the overbought zone but it doesn’t mean we can’t stay there for a while.
ETHUSD (Kraken)
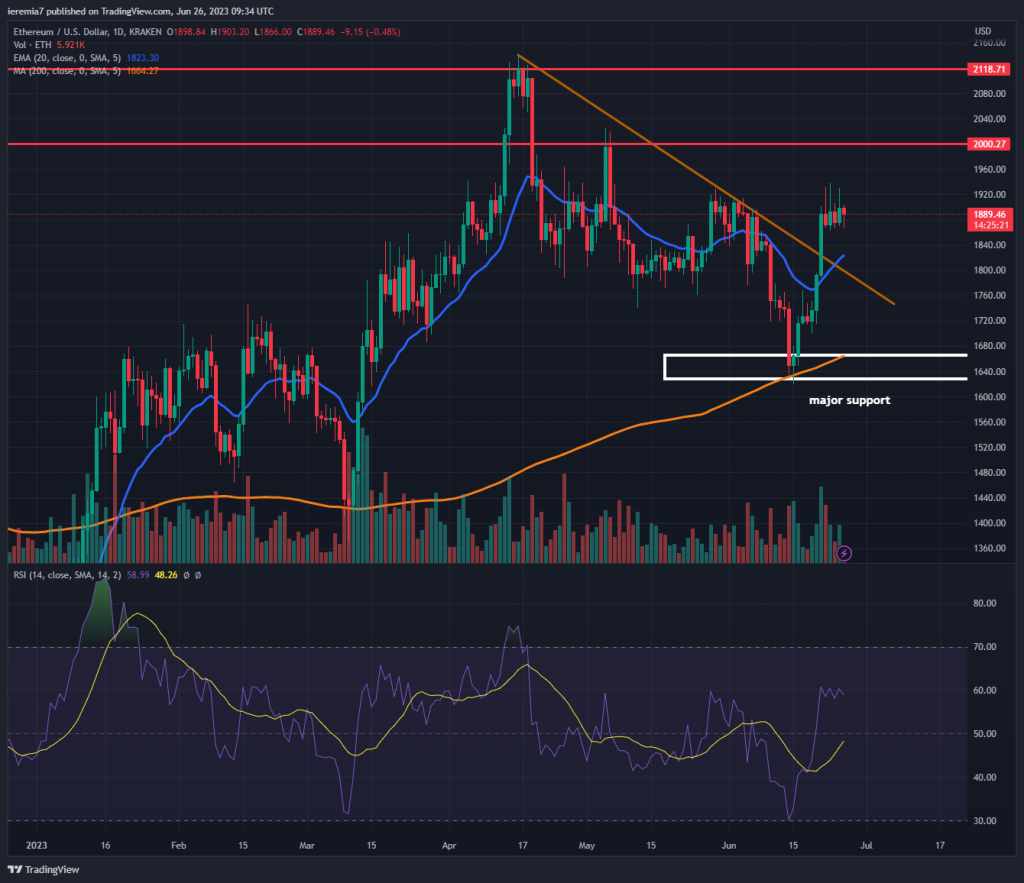
Although posting gains, Ether has been underperforming Bitcoin, suggesting the market has been enthusiastic only about the BlackRock news. ETH is now trading above its trend line as well but still hasn’t touched the $2,000 mark. That’s our first resistance if buying extends well into this week. Above it, $2,100 and the current 2023 high could also act as a cap.
The price action reacted impulsively to the daily 200 SMA and Ether jumped more than 10%. We are also trading above the 20 EMA, which is now another area of support. As long as the price remains above the trend line and the EMA, our sentiment will continue to be bullish. On a break below, the 200 SMA could be back into play as a major support area.
DOTUSD (Binance)
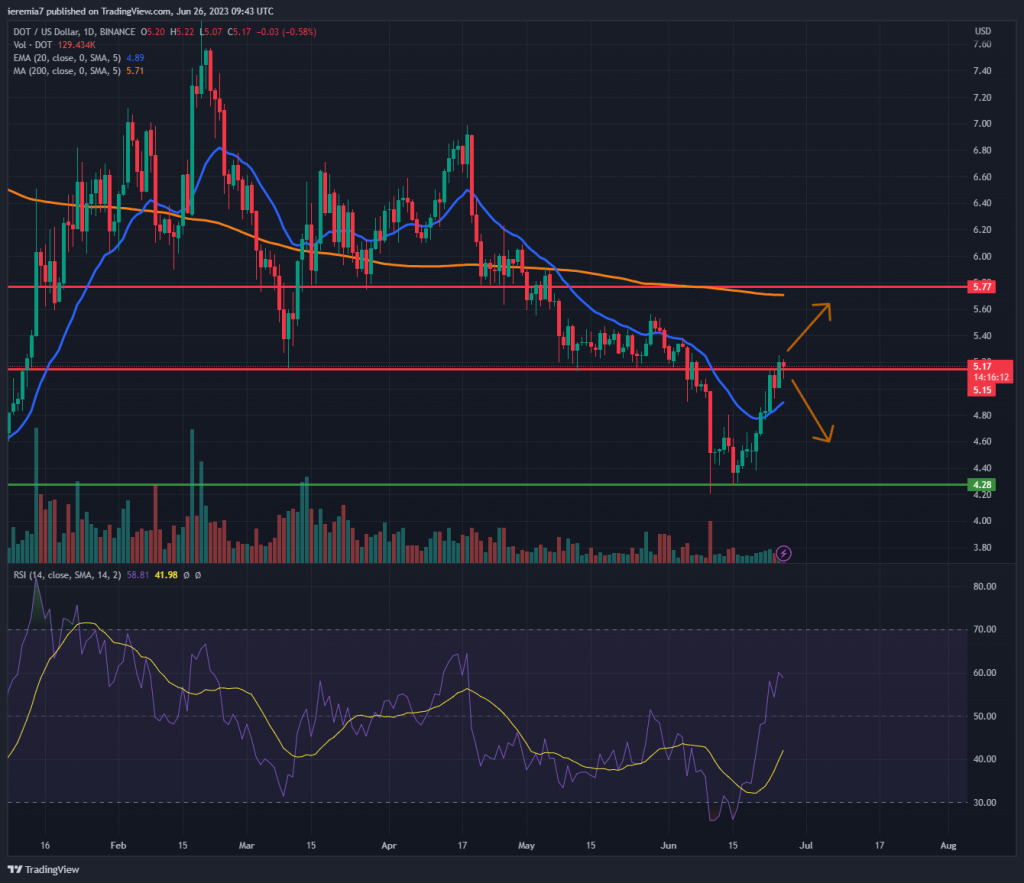
Polkadot is up close to 14% during the last week, suggesting there has been strong buying interest. We see the price managed to break above the daily 20 EMA and is now struggling around $5, a critical resistance zone. A continuation of the move will expose the $5.8 area, as well as the daily 200 SMA, an important line on the chart. The RSI is now yet overbought, which leaves some additional space left for the bulls.
While we maintain a bullish stance above the daily 20 EMA, things change on an impulsive break below it. That will suggest the market participants are selling the rips and could put the $4.2 support area under pressure again.
It’s important to monitor the coins that manage to outperform the market, especially if this happens at an inflection point. Polkadot has the potential to move upward in case there will be strong buying interest across the board as June comes to a close. Thus far it looks like enthusiasm is not contained to only a few names.


There are no comments at the moment, do you want to add one?
Write a comment